All amounts are in United States dollars, unless otherwise stated
"Underground Mineral Reserves at Island Gold have grown for 12 consecutive years. Given the success of our delineation drilling program over the past year, we expect to report another substantial increase in Mineral Reserves. This growth will be included into the Island Gold District Expansion Study to be released this week, supporting a larger and more profitable operation. Our exploration drilling program also continues to demonstrate the significant longer-term upside. Based on our ongoing success, and with the deposit open laterally and at depth, we expect the main Island Gold deposit will continue to grow well into the future. Additionally, I am highly encouraged by the high-grade mineralization we are intersecting at the nearby Cline-Pick past producing mines, including an exceptionally high-grade hole, which demonstrates the real potential for these targets to evolve into additional sources of higher-grade ore within an expanded milling complex,” said John A. McCluskey, President and Chief Executive Officer.
Regional drilling within the past producing Cline-Pick Mines continues to extend high-grade gold mineralization beyond the extent of previous mining. The targets are open in multiple directions, including at depth, with the deepest holes drilled to date down to a vertical depth of only 540 metres (“m”). By comparison, the deepest holes within the main Island Gold structure have intersected high-grade mineralization beyond depths of 1,600 m. The past-producing Cline-Pick and Edwards mines are within seven kilometres of the Magino mill by existing road and are being targeted as potential sources of additional higher-grade mill feed within a larger expansion. New highlights include1,2,3:
Cline-Pick Mines:
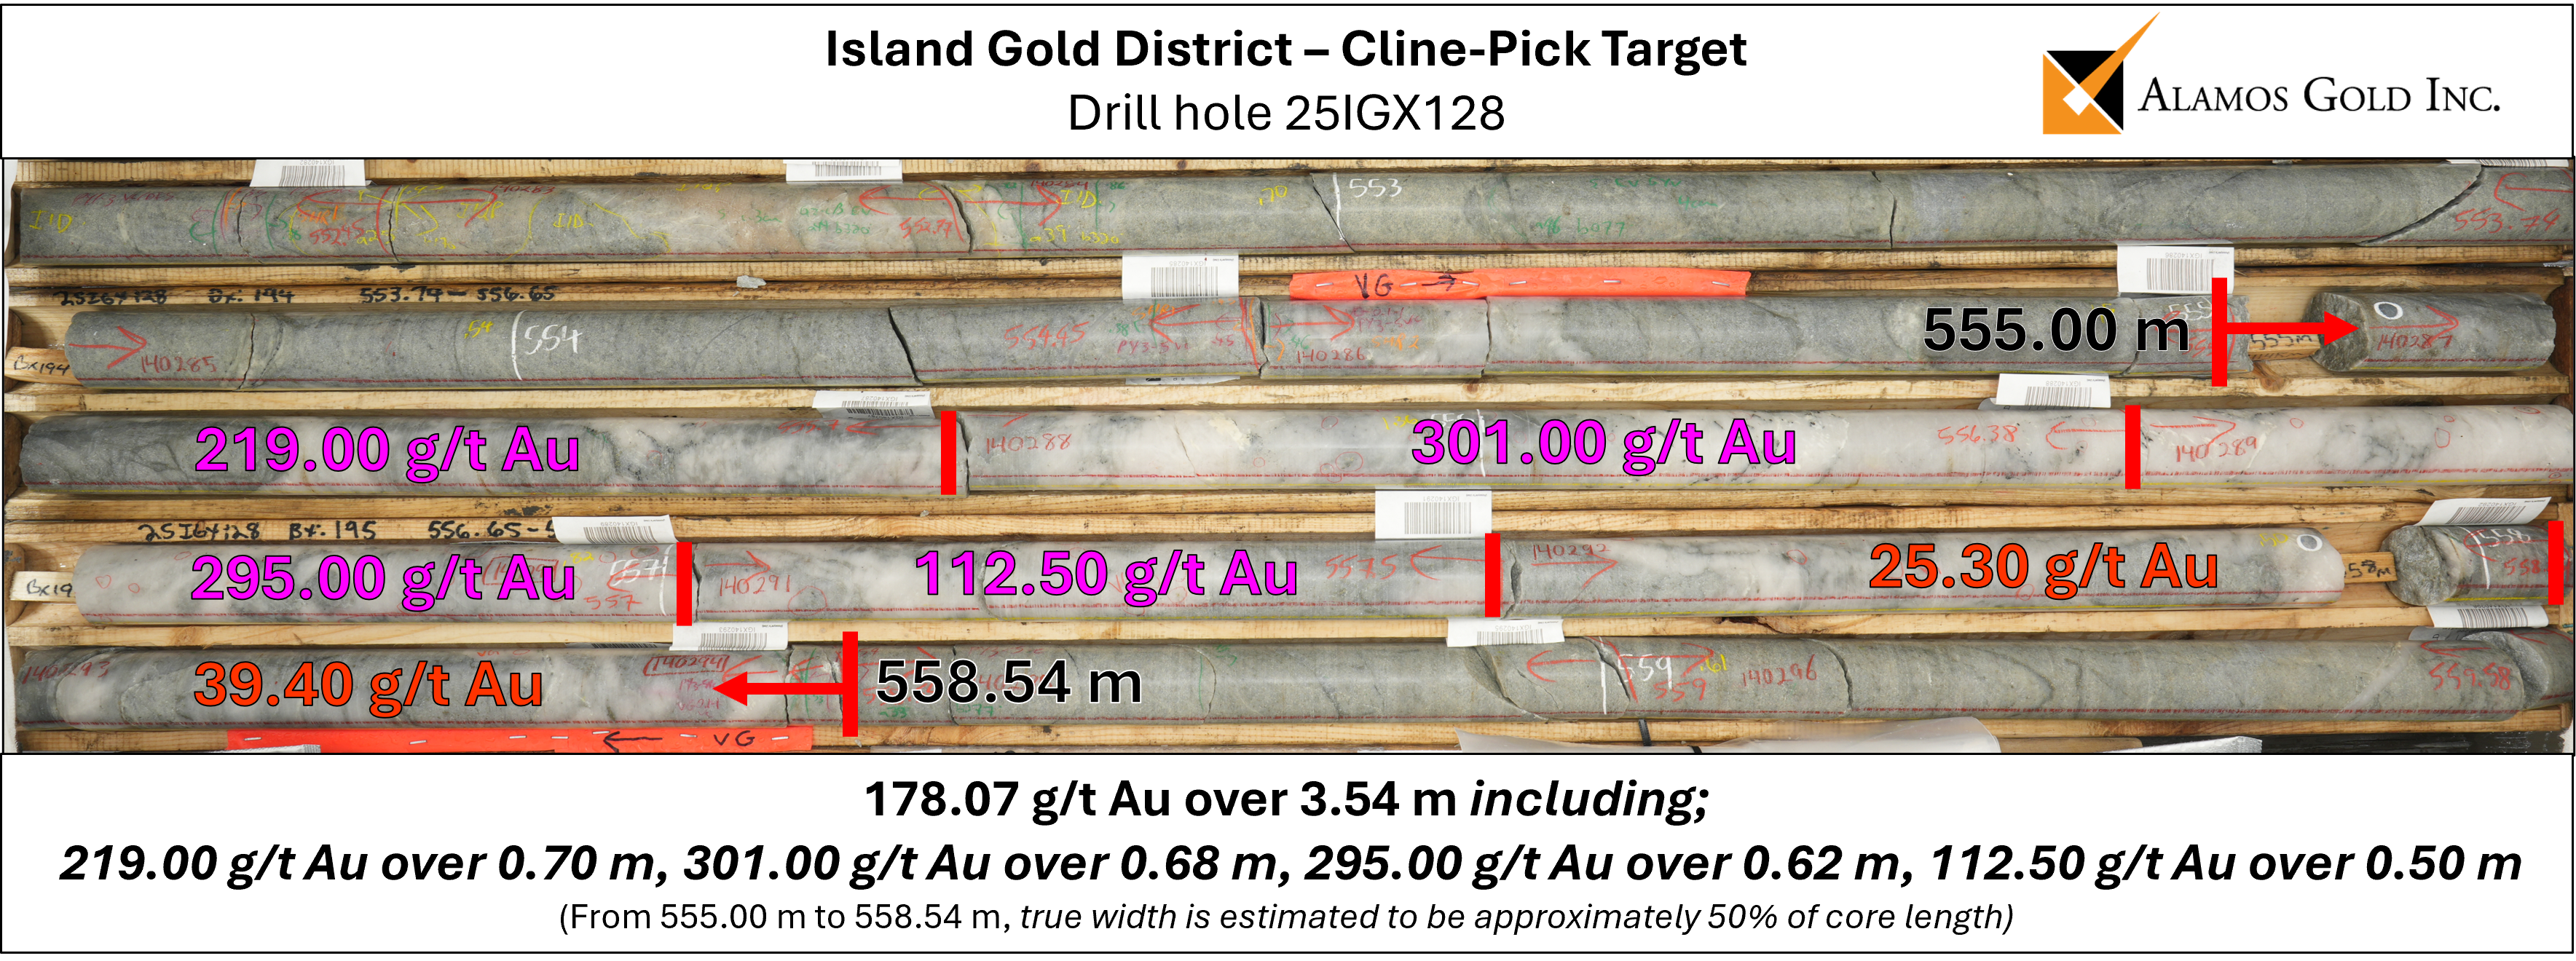
- 178.07 g/t Au over 3.54 m (25IGX128) including1;
- 219.00 g/t Au over 0.70 m;
- 301.00 g/t Au over 0.68 m;
- 295.00 g/t Au over 0.62 m; and
- 112.50 g/t Au over 0.50 m.
- 15.28 g/t Au over 5.52 m (25IGX128) including2;
- 25.20 g/t Au over 0.66 m;
- 19.15 g/t Au over 0.35 m; and
- 40.30 g/t Au over 0.59 m.
- 12.75 g/t Au over 8.79 m (25IGX112), including;
- 93.75 g/t Au over 1.01 m; and
- 23.57 g/t Au over 2.34 m (25IGX124) including;
- 115.00 g/t Au over 0.45 m.
- 115.00 g/t Au over 0.45 m.
Island Gold Main zone exploration highlights: high-grade mineralization extended outside of Mineral Reserves and Resources in the E1E and C-Zones. These zones are the main structures which host the majority of currently defined Mineral Reserves and Resources at Island Gold. New highlights include4:
- Island West (C-Zone)
- 64.70 g/t Au (63.19 g/t cut) over 2.13 m (900-506-23);
- 12.95 g/t Au over 4.10 m (1025-492-06); and
- 13.79 g/t Au over 3.01 m (900-506-19).
- Island East (E1E-Zone)
- 31.53 g/t Au (12.05 g/t cut) over 7.55 m (1190-607-04);
- 9.84 g/t Au (8.64 g/t cut) over 21.41 m (1190-607-18);
- 16.22 g/t Au over 4.49 m (1190-607-13); and
- 11.71 g/t Au over 5.75 m (1190-607-12).
Island Gold Hanging Wall and Footwall exploration highlights: high-grade gold mineralization intersected within new and recently defined hanging wall and footwall zones across the main Island Gold Deposit. These zones represent significant opportunities to continue to grow near mine Mineral Reserves and Resources which are low-cost to develop, given their proximity to existing infrastructure. New highlights include4:
- Island West Hanging Wall and Footwall Zones
NS2 Zone: growing parallel structure, 160 m east of NS1 Zone- 13.81 g/t Au (5.31 g/t cut) over 6.01 m (900-506-44);
-
- 17.23 g/t Au (9.69 g/t cut) over 3.69 m (900-506-22);
- 20.92 g/t Au (8.77 g/t cut) over 2.94 m (900-506-35);
- 20.66 g/t Au (18.79 g/t cut) over 2.87 m (900-506-24); and
- 9.06 g/t Au (6.33 g/t cut) over 5.89 m (900-506-18A).
NS3 Zone: growing parallel structure, 90 m west of NS1 Zone
-
- 58.92 g/t Au (9.93 g/t cut) over 8.00 m (790-460-36);
- 53.98 g/t Au (4.28 g/t cut) over 2.88 m (850-470-07); and
- 39.98 g/t Au (12.88 g/t cut) over 2.31 m (850-475-25).
NS4 Zone: growing parallel structure, 180 m west of NS1 Zone
-
- 24.91 g/t Au (4.45 g/t cut) over 2.46 m (850-472-51); and
- 22.21 g/t Au (7.33 g/t cut) over 2.46 m (900-506-22).
- Island East Footwall Zones
NTH4 Zone
-
- 132.73 g/t Au (34.86 g/t cut) over 2.08 m (1160-625-26); and
- 8.99 g/t Au over 6.08 m (1160-625-25).
Island Gold East delineation and definition drilling highlights: the primary focus of the 2025 drill program was the conversion of a portion of the large Mineral Resource base to Reserves. Surface and underground delineation drilling has been successful over the past year in driving significant Mineral Reserve growth that will be incorporated into the Expansion Study to be released this week. New highlights include4:
E1E-Zone
- 54.85 g/t Au (39.73 g/t cut) over 17.99 m (MH42-03);
- 56.05 g/t Au (35.02 g/t cut) over 7.05 m (MH41-01);
- 60.00 g/t Au (57.81 g/t cut) over 4.08 m (MH41-03);
- 87.63 g/t Au (46.48 g/t cut) over 2.43 m (945-624-87);
- 48.31 g/t Au (47.68 g/t cut) over 2.11 m (1160-625-15);
- 5.27 g/t Au over 14.72 m (945-624-75);
- 5.88 g/t Au over 13.09 m (945-624-78);
- 4.11 g/t Au over 17.50 m (1190-607-08);
- 13.55 g/t Au over 5.29 m (MH42-02); and
- 18.71 g/t Au (14.89 g/t cut) over 3.44 m (1190-607-09).
C-Zone
- 21.41 g/t Au (14.77 g/t cut) over 5.56 m (890-461-54);
- 43.26 g/t Au over 2.17 m (490-450-06); and
- 10.83 g/t Au over 3.07 m (1025-503-16).
1 All reported composite intervals reported as uncut, and composites lengths are reported as core length. True width is estimated to be 40 to 85% of core length unless otherwise indicated. Composites are calculated with a 0.5 g/t cut-off, maximum internal waste of 4 m, and no minimum length. Higher-grade intervals within the primary drillhole composite are reported as “Including” for any individual or consecutive samples with assay grades greater than 10 g/t Au.
2 True width is estimated to be approximately 50% of core length.
3 True width is estimated to be 10-20% of core length.
4 All reported composite intervals are calculated true width of the mineralized zones. Drillhole composite intervals reported as “cut” include higher grade samples which have been cut to: Island West and Island Main (C-zone) @ 230 g/t Au; Island Main and East (E1E Zone) @ 185 g/t Au; B Zone @ 120 g/t Au; NS1 Zone and NTH4 @ 100 g/t Au; D1 zone @ 45 g/t Au; NS2, NS3 and NS4 zone @ 35 g/t Au.
New highlight intercepts can be found in Tables 1 to 3, and in Figures 1 to 7 at the end of this news release.
2025 Exploration Drilling Program
A total of $24 million was spent on exploration at the Island Gold District in 2025, up from $20 million spent in 2024. Following up on a successful 2024 program, a total of 46,889 m of underground drilling was completed in 180 holes in 2025 with a focus on defining new Mineral Reserves and Resources in proximity to existing production horizons and infrastructure. Additionally, 14,609 m of surface exploration drilling was completed in 15 holes targeting the area between the Island Gold and Magino deposits, as well as the down-plunge extension of the Island Gold deposit, below a depth of 1,500 m. Over the past five years, the discovery cost of the high-grade Mineral Resource additions has averaged an attractive $13 per ounce.
A primary focus of the 2025 drill program was the conversion of a portion of the large Mineral Resource base to Mineral Reserves to be included in the Island Gold District Expansion Study. As part of that focus a total of 33,964 m of underground delineation drilling was completed in 117 holes, and 12,269 m of surface delineation drilling was completed in 12 holes. Additionally, 22,390 m of surface delineation drilling was completed in 51 holes at Magino.
A total of 11,060 m drilling was also completed in 36 holes as part of regional exploration program at the Island Gold District. The program focused on stepping out from high-grade mineralization intersected at the Cline-Pick deposit located approximately seven kilometres northeast of the Island Gold mine, with 29 holes totalling 9,911 m completed in 2025. Initial drilling was completed at the past-producing Edwards Mine, which was successful in expanding high-grade mineralization and will continue to be advanced as part of the 2026 program.
Island West
Underground Exploration Drilling
High-grade gold mineralization further extended outside of existing Mineral Reserves and Resources in the middle portion of Island West. Drilling is being conducted from the 900 and 1025-levels, between vertical depths of 900 m and 1,400 m.
New highlights in the C-Zone include (Figure 1, Table 1) 1:
- Island West (C-Zone)
- 64.70 g/t Au (63.19 g/t cut) over 2.13 m (900-506-23);
- 12.95 g/t Au over 4.10 m (1025-492-06);
- 13.79 g/t Au over 3.01 m (900-506-19); and
- 6.11 g/t Au over 5.28 m (1025-492-07).
Island West Hanging Wall Zones
In addition to testing the main Island Gold structure (C-Zone), underground exploration drilling continued to target high-grade gold mineralization in sub-parallel and perpendicular structures in the hanging wall from the 850 and 1025-levels (Table 1, Figure 2).
NS Hanging Wall Zones
The NS1 zone is a northwest-striking structure with a high-angle orientation relative to the C-Zone that was discovered in early 2023. The first stopes were mined from the NS1 zone during the second half of 2023, and it continues to be actively mined, highlighting the near-term opportunities within these hanging wall and footwall zones.
The NS2 zone is a northwest-striking structure discovered in 2024, 160 m east of and subparallel to the NS1 zone. To date, this zone has been defined over a vertical extent of 300 m, and an average strike of 100 m. Recent drilling suggests that the vertical extent could extend to at least 400 m.
In addition, as highlighted in the January 13, 2025 exploration update, several other north-striking high-angle structures have been identified across the deposit from reinterpretation of historical hanging wall drilling, including the NS3 and NS4 zones which have been further drill tested in 2025. These hanging wall zones currently have grades capped at 35 g/t Au, compared to the NS2 and NTH4 zones which are capped at 100g/t Au, and other areas of the main Island Gold structure that are capped at 230 g/t Au. As additional drilling is completed and information compiled there is strong potential for capping factors within several of these hanging wall zones to increase.
These structures will continue to be further evaluated as underground exploration drilling advances, and represent significant opportunities to continue to grow near mine Mineral Reserves and Resources which are low-cost to develop, given their proximity to existing infrastructure.
New highlights from the Island West Hanging Wall zones include1 (Table 1, Figure 2):
NS2 Zone: growing parallel structure, 160 m east of NS1 Zone
- 13.81 g/t Au (5.31 g/t cut) over 6.01 m (900-506-44);
- 17.23 g/t Au (9.69 g/t cut) over 3.69 m (900-506-22);
- 20.92 g/t Au (8.77 g/t cut) over 2.94 m (900-506-35);
- 20.66 g/t Au (18.79 g/t cut) over 2.87 m (900-506-24);
- 9.06 g/t Au (6.33 g/t cut) over 5.89 m (900-506-18A);
- 4.42 g/t Au over 8.80 m (900-506-27); and
- 6.58 g/t Au over 5.16 m (900-506-30).
NS3 Zone: growing parallel structure, 90 m west of NS1 Zone
- 58.92 g/t Au (9.93 g/t cut) over 8.00 m (790-460-36);
- 53.98 g/t Au (4.28 g/t cut) over 2.88 m (850-470-07); and
- 39.98 g/t Au (12.88 g/t cut) over 2.31 m (850-475-25).
NS4 Zone: growing parallel structure, 180 m west of NS1 Zone
- 24.91 g/t Au (4.45 g/t cut) over 2.46 m (850-472-51); and
- 22.21 g/t Au (7.33 g/t cut) over 2.46 m (900-506-22).
Island East
Underground Exploration Drilling
Underground drilling continues to extend high-grade gold mineralization outside of Mineral Reserves and Resources in upper to middle portions of Island East.
New highlights in the E1E-Zone include (Figure 1, Table 1):
- Island East (E1E-Zone)
- 31.53 g/t Au (12.05 g/t cut) over 7.55 m (1190-607-04);
- 9.84 g/t Au (8.64 g/t cut) over 21.41 m (1190-607-18);
- 16.22 g/t Au over 4.49 m (1190-607-13);
- 11.71 g/t Au over 5.75 m (1190-607-12); and
- 8.52 g/t Au over 3.65 m (1190-607-10).
Underground and Surface Delineation Drilling
Island Gold East delineation drilling highlights: Ongoing surface and underground delineation drilling is focused on and been successful in converting of a significant portion of the large Mineral Resource base to Reserves which will be incorporated into the Expansion Study to be released this week. New highlights include1 (Figure 3, Table 2):
E1E-Zone
- 54.85 g/t Au (39.73 g/t cut) over 17.99 m (MH42-03);
- 56.05 g/t Au (35.02 g/t cut) over 7.05 m (MH41-01);
- 60.00 g/t Au (57.81 g/t cut) over 4.08 m (MH41-03);
- 87.63 g/t Au (46.48 g/t cut) over 2.43 m (945-624-87);
- 48.31 g/t Au (47.68 g/t cut) over 2.11 m (1160-625-15);
- 5.27 g/t Au over 14.72 m (945-624-75);
- 5.88 g/t Au over 13.09 m (945-624-78);
- 4.11 g/t Au over 17.50 m (1190-607-08);
- 13.55 g/t Au over 5.29 m (MH42-02);
- 18.71 g/t Au (14.89 g/t cut) over 3.44 m (1190-607-09);
- 18.64 g/t Au (12.88 g/t cut) over 2.99 m (945-622-03);
- 26.28 g/t Au over 2.10 m (945-624-68);
- 4.09 g/t Au over 12.18 m (1190-607-03);
- 4.49 g/t Au over 10.15 m (1160-625-29);
- 9.28 g/t Au over 4.58 m (945-624-95);
- 13.76 g/t Au over 2.91 m (945-622-07);
- 8.70 g/t Au over 4.00 m (945-622-02);
- 11.52 g/t Au over 2.86 m (945-624-88);
- 6.86 g/t Au over 4.65 m (1190-607-19);
- 7.31 g/t Au over 4.15 m (1190-607-09);
- 7.03 g/t Au over 3.70 m (945-624-99); and
- 5.20 g/t Au over 4.15 m (MH44-02).
C-Zone
- 21.41 g/t Au (14.77 g/t cut) over 5.56 m (890-461-54);
- 43.26 g/t Au over 2.17 m (490-450-06);
- 10.83 g/t Au over 3.07 m (1025-503-16);
- 13.08 g/t Au over 2.16 m (1025-503-12);
- 3.94 g/t Au over 6.92 m (850-470-04);
- 10.96 g/t Au over 2.06 m (1025-503-20); and
- 10.17 g/t Au over 2.00 m (850-472-13).
Island East Footwall Zones
Underground exploration drilling continues to target and expand high-grade gold mineralization in structures in the footwall from the 1160-level. Ongoing drilling continues to confirm the continuity and extend high-grade gold mineralization within the NTH4 zones, which intersect with the E1E zone and extend up to 110 m into the footwall.
New highlights from the Island East Footwall zones include1 (Figure 2, Table 1):
- Island East Footwall Zones
NTH4 Zone
-
- 132.73 g/t Au (34.86 g/t cut) over 2.08 m (1160-625-26); and
- 8.99 g/t Au over 6.08 m (1160-625-25).
As with the hanging wall and footwall zones in Island West, these footwall zones in Island East highlight the potential to add high-grade Mineral Reserves and Resources in proximity to existing production horizons and infrastructure which would be low-cost to develop and mine.
1 All reported composite intervals are calculated true width of the mineralized zones. Drillhole composite intervals reported as “cut” include higher grade samples which have been cut to: Island West and Island Main (C-zone) @ 230 g/t Au; Island Main and East (E1E Zone) @ 185 g/t Au; B Zone @ 120 g/t Au; NS1 Zone and NTH4 @ 100 g/t Au; D1 zone @ 45 g/t Au; NS2, NS3 and NS4 zone @ 35 g/t Au.
Regional Exploration: Cline-Pick and Edwards Mines
History
The Cline-Pick and Edwards (“CEP”) mines are located seven kilometres by road northeast of the Magino Mill. Alamos acquired these past-producing mines in 2020 as part of its consolidation of the northeastern segment of the Michipicoten Greenstone Belt with the acquisition of Trillium Mining Corp.
Historic interest in the area dates to 1918 with Cline Lake Gold Mines Ltd & O’Brien Gold Mining Ltd developing underground from the Shaft 3 and 4 areas (Figure 4, 5, and 6). Shaft 4 was the focus of mining operations between 1938-1942 producing 63,328 oz Au (300,981 tonnes @ 6.55 g/t Au). The property remained inactive until Pick Mines Ltd. acquired the property in 1959 and continued lateral development from Shaft 3. No production resulted from the Pick Mines period with the property reverting to the Crown in 1974. The Pick property was closed to staking until the early 1980’s with it changing ownership multiple times until being acquired by Alamos in 2020.
At Edwards, interest dates to 1924 with Peter Edwards staking the original claims that are optioned a year later by Hollinger Gold Mines. The main historic Shaft 1 was sunk and mining operations commenced from 1933-1937 producing 435 oz Au (1,426 tonnes @ 10.6 g/t Au). Property ownership changed multiple times until 1996, when River Gold Mines in partnership with VenCan Gold Corporation developed a portal/decline to the south-west of Shaft 1 and mined two ore shoots to the 280 m level. Production continued until gold prices fell in 2001, forcing the closure of the mine. During this period, the Edwards mine produced 140,000 oz. Au (387,000 tonnes @ 11.2 g/t Au). The Edwards property was bought by Strike Minerals Inc. in 2002 and throughout their ownership they were able to develop exploration drifts to the North at the 60m and 90m levels at Edwards Shaft. There has been no further production on the Edwards Mine since its closure.
Since then, detailed historical data compilation, historic mine working digitization, and geological modelling has been completed which has supported exploration targeting within the larger gold system without the limitations of mineral tenure boundaries.
2025 Exploration Program
A total of 9,911 m of drilling was completed in 29 holes in 2025 at CEP, of which eight holes were previously reported (see press release June 24, 2025), with 16 holes being reported in this release. Assays are pending for the remaining five holes. Since 2023, Alamos has completed 19,448 m of drilling in 56 holes at CEP as part of the regional drilling program (in addition to 8 abandoned holes). The 2026 regional exploration program includes 16,000 m of surface exploration drilling, of which 12,500 m will be focused at CEP with the objective of advancing the deposits towards a Mineral Resource estimate.
This drilling continues to expand high-grade gold mineralization beyond the extent of historic mining. Extension of high-grade gold mineralization at these historic mines represent potential future sources of additional ore within a larger expansion of the Magino mill.
Drill hole 25IGX128
One of the highlight intersections from Cline-Pick is drill hole 25IGX128, which targeted a 300 m gap in drilling, at approximately 430 m depth from surface, where a moderate east plunging ore shoot is associated with a subvertical east-west trending shear zone.
Within proximity to the shear zone, extensional veins hosting high-grade gold mineralization were intersected. As interpreted from the core angles and vein margins, a first extensional vein was drilled at a low-angle to core axis dip and intersected 15.28 g/t Au over 5.52 m. As a result, true width is estimated to be 10-20% of core length.
A second milky white vein with >75 occurrences of coarse visible gold was intersected which returned a composite interval of 178.07 g/t Au over 3.54 m. The vein has been interpreted as a moderate-steeply dipping shear-vein, with true width estimated at approximately 50% of core length.
Drilling is underway to follow up these intersections and step out within the shear zone to further define geometry and orientations of both the shear and the veins, as well as to determine the controls on gold mineralization. The hole represents one of the deeper holes drilled at Cline-Pick, with the main structure remaining open at depth and along strike.
New highlights include3,4,5:
Cline-Pick Mines:
- 178.07 g/t Au over 3.54 m (25IGX128) including4;
- 219.00 g/t Au over 0.70 m;
- 301.00 g/t Au over 0.68 m;
- 295.00 g/t Au over 0.62 m; and
- 112.50 g/t Au over 0.50 m.
- 15.28 g/t Au over 5.52 m (25IGX128) including5;
- 25.20 g/t Au over 0.66 m;
- 19.15 g/t Au over 0.35 m; and
- 40.30 g/t Au over 0.59 m.
- 12.75 g/t Au over 8.79 m (25IGX112), including;
- 93.75 g/t Au over 1.01 m.
- 23.57 g/t Au over 2.34 m (25IGX124) including;
- 115.00 g/t Au over 0.45 m.
- 2.41 g/t Au over 18.36 m (25IGX128) including;
- 24.00 g/t Au over 0.38 m; and
- 34.40 g/t Au over 0.30 m.
- 1.29 g/t Au over 32.30 m (25IGX117);
- 6.07 g/t Au over 6.63 m (25IGX110) including;
- 32.70 g/t Au over 0.80 m; and
- 19.10 g/t Au over 0.47 m.
- 4.62 g/t Au over 6.91 m (25IGX114A) including;
- 15.30 g/t Au over 0.85 m.
- 2.36 g/t Au over 12.18 m (25IGX115) including;
- 26.50 g/t Au over 0.66 m.
- 1.57 g/t Au over 15.60 m (25IGX116) including;
- 11.50 g/t Au over 0.35 m.
- 5.53 g/t Au over 3.63 m (25IGX119) including;
- 11.10 g/t Au over 1.17 m.
- 6.34 g/t Au over 3.36 m (25IGX119), including;
- 17.78 g/t Au over 1.13 m.
- 3.75 g/t Au over 5.28 m (25IGX119) including;
- 12.05 g/t Au over 1.49 m.
- 2.80 g/t Au over 6.72 m (25IGX127B) including;
- 17.25 g/t Au over 0.57 m.
- 4.79 g/t Au over 3.68 m (25IGX111) including;
- 37.30 g/t Au over 0.70 m.
- 23.00 g/t Au over 0.58 m (25IGX121);
- 1.62 g/t Au over 8.77 m (25IGX112) including;
- 10.15 g/t Au over 0.57 m.
- 12.70 g/t Au over 0.98 m (25IGX113);
- 16.95 g/t Au over 0.64 m (25IGX117);
- 2.23 g/t Au over 4.98 m (25IGX122) including;
- 18.35 g/t Au over 0.41 m; and
- 1.88 g/t Au over 5.42 m (25IGX111) including;
- 16.15 g/t Au over 0.36 m.
- 16.15 g/t Au over 0.36 m.
3 All reported composite intervals reported as uncut, and composites lengths are reported as core length. True width is estimated to be 40 to 85% of core length unless otherwise stated. Composites are calculated with a 0.5 g/t cut-off, maximum internal waste of 4 m, and no minimum length. Higher-grade intervals within the primary drillhole composite are reported as “Including” for any individual or consecutive samples with assay grades greater than 10 g/t Au.
4 True width is estimated to be approximately 50% of core length.
5 True width is estimated to be 10-20% of core length.
Qualified Persons
Scott R.G. Parsons, P.Geo., FAusIMM, Alamos Gold’s Vice President, Exploration, has reviewed and approved the scientific and technical information contained in this news release. Scott R.G. Parsons is a “Qualified Person” as defined by Canadian Securities Administrators’ National Instrument 43-101 - Standards of Disclosure for Mineral Projects.
Exploration programs at the Island Gold District are directed and supervised by Tyler Poulin, P.Geo., Geology Superintendent at the Island Gold Mine. Tyler Poulin is a “Qualified Person” as defined by Canadian Securities Administrators’ National Instrument 43-101 - Standards of Disclosure for Mineral Projects.
Quality Assurance and Quality Control
Alamos Gold maintains an internal Quality Assurance / Quality Control (QA/QC) program at the Island Gold Mine to ensure sampling and analysis of all exploration work is conducted in accordance with best practices.
Access to the Island Gold Mine is controlled by security personnel. Drill core is logged and sampled at core logging facilities within the mine site under the supervision of a Qualified Geologist. A geologist marks the individual samples for analysis, and sample intervals, sample numbers, standards and blanks are entered into the database. Exploration core is cut in half using an electric core saw equipped with a diamond tipped blade. One half of the core is placed into a plastic sample bag and sealed with zip ties in preparation for shipment. The other half of the core is returned to the core box and retained for future reference. Approximately 20% of all delineation core is cut and stored, and the entire core sample is sent for analysis on all definition programs.
The samples are placed in large heavy-duty nylon reinforced Fabrene bags, which are identified and sealed before being placed on pallets. The core samples are picked up at the mine site and mine samples are delivered to AGAT and Actlabs laboratories, and regional samples are delivered to ALS laboratory, all located in Thunder Bay, Ontario.
Gold is analyzed by a 50 grams fire assay with an Atomic Absorption (AA) finish. Mine samples greater than 10.0 g/t Au, and regional samples greater than 5.0 g/t Au are re-analyzed using gravimetric finish methods. AGAT, Actlabs and ALS are certified laboratories and have internal quality control (“QC”) programs that include insertion of reagent blanks, reference materials, and pulp duplicates.
The Corporation inserts QC samples (blanks and reference materials) at regular intervals to monitor laboratory performance. Cross check assays are completed on a regular basis in a secondary accredited laboratory. The Island Gold Mine QA/QC procedures are more completely described in the August 6, 2025 Technical Report filed on SEDAR+ (www.sedarplus.ca).
About Alamos
Alamos is a Canadian-based intermediate gold producer with diversified production from three operations in North America. This includes the Island Gold District and Young-Davidson mine in northern Ontario, Canada, and the Mulatos District in Sonora State, Mexico. Additionally, the Company has a strong portfolio of growth projects, including the Phase 3+ Expansion at Island Gold, and the Lynn Lake project in Manitoba, Canada. Alamos employs more than 2,400 people and is committed to the highest standards of sustainable development. The Company’s shares are traded on the TSX and NYSE under the symbol “AGI”.
FOR FURTHER INFORMATION, PLEASE CONTACT:
| Scott K. Parsons | |
| Senior Vice President, Corporate Development & Investor Relations | |
| (416) 368-9932 x 5439 | |
| Khalid Elhaj | |
| Vice President, Business Development & Investor Relations | |
| (416) 368-9932 x 5427 | |
| ir@alamosgold.com | |
The TSX and NYSE have not reviewed and do not accept responsibility for the adequacy or accuracy of this release.
Cautionary Note
This news release includes certain statements that constitute forward-looking information within the meaning of applicable Canadian and U.S. securities laws ("forward-looking statements"). All statements in this news release other than statements of historical fact, which address events, results, outcomes, or developments that Alamos expects to occur are forward-looking statements. Forward-looking statements are generally, but not always, identified by the use of forward-looking terminology such as "expect", "plan", "estimate", “target”, “prospective” “potential”, “opportunity”, “ongoing”, “continued” or variations of such words and phrases and similar expressions or statements that certain actions, events or results "may", "could", "would", "might" or "will" be taken, occur or be achieved or the negative connotation of such terms.
Such statements in this news release include, without limitation, statements with respect to planned exploration programs, focuses, strategies, drilling targets and work, potential for further exploration of certain areas, potential exploration and drilling results and related expectations, costs and expenditures, including with respect to the cost of development and production, project economics, profitability of operations; gold price assumptions, potential mineralization, projected ore grades, opportunities to add near mine and further high-grade Mineral Reserves and Mineral Resources, expected continued growth of the main Island Gold Deposit; the Island Gold District Expansion Study, the expansion of the Magino mill, and other statements and information that is based on forecasts and projections of future operational, geological or financial results, estimates of amounts not yet determinable and assumptions of management.
Exploration results that include geophysics, sampling, and drill results on wide spacings may not be indicative of the occurrence of a mineral deposit. Such results do not provide assurance that further work will establish sufficient grade, continuity, metallurgical characteristics and economic potential to be classed as a category of Mineral Resource. A Mineral Resource that is classified as "inferred" or "indicated" has a great amount of uncertainty as to its existence and economic and legal feasibility. It cannot be assumed that any or part of an "Indicated Mineral Resource" or "Inferred Mineral Resource" will ever be upgraded to a higher category of Mineral Resource. Investors are cautioned not to assume that all or any part of mineral deposits in these categories will ever be converted into Proven and Probable Mineral Reserves.
Alamos cautions that forward-looking statements are necessarily based upon several factors and assumptions that, while considered reasonable by management at the time of making such statements, are inherently subject to significant business, economic, technical, legal, political and competitive uncertainties and contingencies. Known and unknown factors could cause actual results to differ materially from those projected in the forward-looking statements, and undue reliance should not be placed on such statements and information.
These factors and assumptions include, but are not limited to: the actual results of current exploration activities; changes to current estimates of mineral reserves and mineral resources; conclusions of economic and geological evaluations; changes in project parameters as plans continue to be refined; operations may be exposed to illness, disease, epidemic or pandemic which may impact, among other things, the broader market; state and federal orders or mandates (including with respect to mining operations generally or auxiliary businesses or services required for the Company’s operations) in Canada, Mexico and other jurisdictions in which the Company does or may conduct business; the duration of regulatory responses to any illness, disease, epidemic or pandemic; changes in national and local government legislation, controls or regulations; failure to comply with environmental and health and safety laws and regulations; labour and contractor availability (and being able to secure the same on favourable terms); ability to sell or deliver gold doré bars; disruptions in the maintenance or provision of required infrastructure and information technology systems; fluctuations in the price of gold or certain other commodities such as, diesel fuel, natural gas, and electricity; operating or technical difficulties in connection with mining or development activities, including geotechnical challenges and changes to production estimates (which assume accuracy of projected ore grade, mining rates, recovery timing and recovery rate estimates and may be impacted by unscheduled maintenance); changes in foreign exchange rates (particularly the Canadian dollar, U.S. dollar, and Mexican peso); the impact of inflation; the potential impact of any tariffs, trade barriers and/or regulatory costs; employee and community relations; litigation and administrative proceedings; disruptions affecting operations; risks associated with the startup of new mines; availability of and increased costs associated with mining inputs and labour; delays in the development or updating of mine plans; inherent risks and hazards associated with mining and mineral processing including environmental hazards, industrial accidents, unusual or unexpected formations, pressures and cave-ins; the risk that the Company’s mines may not perform as planned; uncertainty with the Company's ability to secure additional capital to execute its business plans; the speculative nature of mineral exploration and development, risks in obtaining and maintaining necessary licenses, permits and authorizations, contests over title to properties; expropriation or nationalization of property; political or economic developments in Canada or Mexico and other jurisdictions in which the Company does or may carry on business in the future; increased costs and risks related to the potential impact of climate change; the costs and timing of exploration, construction and development of new deposits; risk of loss due to sabotage, protests and other civil disturbances; the impact of global liquidity and credit availability and the values of assets and liabilities based on projected future cash flows; and business opportunities that may be pursued by the Company.
For a more detailed discussion of such risks and other factors that may affect the Company's ability to achieve the expectations set forth in the forward-looking statements contained in this news release, see the Company’s latest 40-F/Annual Information Form and Management’s Discussion and Analysis, each under the heading “Risk Factors”, available on the SEDAR+ website at www.sedarplus.ca or on EDGAR at www.sec.gov. The foregoing should be reviewed in conjunction with the information and risk factors and assumptions found in this news release.
The Company disclaims any intention or obligation to update or revise any forward-looking statements, whether written or oral, or whether as a result of new information, future events or otherwise, except as required by applicable law.
Note to U.S. Investors – Mineral Reserve and Resource Estimates
Unless otherwise indicated, all Mineral Resource and Mineral Reserve estimates included in this news release have been prepared in accordance with Canadian National Instrument 43-101 - Standards of Disclosure for Mineral Projects (“NI 43-101”) and the Canadian Institute of Mining, Metallurgy and Petroleum (the “CIM”) - CIM Definition Standards on Mineral Resources and Mineral Reserves, adopted by the CIM Council, as amended (the “CIM Standards”). NI 43-101 is a rule developed by the Canadian Securities Administrators, which established standards for all public disclosure an issuer makes of scientific and technical information concerning mineral projects. Mining disclosure in the United States was previously required to comply with SEC Industry Guide 7 (“SEC Industry Guide 7”) under the United States Securities Exchange Act of 1934, as amended. The U.S. Securities and Exchange Commission (the “SEC”) has adopted final rules, to replace SEC Industry Guide 7 with new mining disclosure rules under sub-part 1300 of Regulation S-K of the U.S. Securities Act (“Regulation S-K 1300”) which became mandatory for U.S. reporting companies beginning with the first fiscal year commencing on or after January 1, 2021. Under Regulation S-K 1300, the SEC now recognizes estimates of “Measured Mineral Resources”, “Indicated Mineral Resources” and “Inferred Mineral Resources”. In addition, the SEC has amended its definitions of “Proven Mineral Reserves” and “Probable Mineral Reserves” to be substantially similar to international standards.
Investors are cautioned that while the above terms are “substantially similar” to CIM Definitions, there are differences in the definitions under Regulation S-K 1300 and the CIM Standards. Accordingly, there is no assurance any mineral reserves or mineral resources that the Company may report as “proven mineral reserves”, “probable mineral reserves”, “measured mineral resources”, “indicated mineral resources” and “inferred mineral resources” under NI 43-101 would be the same had the Company prepared the mineral reserve or mineral resource estimates under the standards adopted under Regulation S-K 1300. U.S. investors are also cautioned that while the SEC recognizes “measured mineral resources”, “indicated mineral resources” and “inferred mineral resources” under Regulation S-K 1300, investors should not assume that any part or all of the mineralization in these categories will ever be converted into a higher category of mineral resources or into mineral reserves. Mineralization described using these terms has a greater degree of uncertainty as to its existence and feasibility than mineralization that has been characterized as reserves. Accordingly, investors are cautioned not to assume that any measured mineral resources, indicated mineral resources, or inferred mineral resources that the Company reports are or will be economically or legally mineable.
| Table 1: Island Gold – Previously Unreleased Select Composite Intervals from Surface and Underground Exploration Drilling Composite intervals greater than 3 g/t Au weighted average, capping values: Island West and Island Main (C-Zone) @ 230 g/t Au; Island Main and East (E1E Zone) @ 185 g/t Au; B Zone @ 120 g/t Au; NS1 Zone and NTH4 @ 100 g/t Au; D1 zone @ 45 g/t Au; NS2, NS3 and NS4 zone @ 35 g/t Au. | |||||||||
| Hole ID | Zone | Target Area | From (m) | To (m) | Core Length (m) | True Width (m) | Au Uncut (g/t) | Au Cut (g/t) | Vertical Depth (m) |
| 560-481-12 | B | Island West Hanging Wall | 178.40 | 184.55 | 6.15 | 2.20 | 3.35 | 3.35 | 455 |
| 850-472-34 | B | Island West Hanging Wall | 169.65 | 174.05 | 4.40 | 2.45 | 3.15 | 3.15 | 1008 |
| 900-506-23 | C | Island West | 121.85 | 126.03 | 4.18 | 2.13 | 64.70 | 63.19 | 878 |
| 900-506-19 | C | Island West | 96.00 | 99.90 | 3.90 | 3.01 | 13.79 | 13.79 | 920 |
| 1025-492-06 | C | Island West | 270.10 | 274.90 | 4.80 | 4.10 | 12.95 | 12.95 | 1106 |
| 1025-503-26 | C | Island West | 231.60 | 235.55 | 3.95 | 2.06 | 11.12 | 11.12 | 1099 |
| 790-460-37 | C | Island West | 96.65 | 101.04 | 4.39 | 1.95 | 6.78 | 6.78 | 854 |
| 560-481-16 | C | Island West | 78.05 | 82.30 | 4.25 | 1.89 | 6.41 | 6.41 | 507 |
| 1025-492-07 | C | Island West | 328.00 | 347.00 | 19.00 | 5.28 | 6.11 | 6.11 | 1170 |
| 900-506-35 | C | Island West | 96.60 | 102.90 | 6.30 | 3.88 | 4.30 | 4.30 | 887 |
| 850-472-43 | C | Island West | 172.75 | 175.30 | 2.55 | 2.05 | 3.26 | 3.26 | 977 |
| 790-460-15 | D1 | Island West Footwall | 98.60 | 102.27 | 3.67 | 3.55 | 4.98 | 4.98 | 841 |
| 1190-607-13 | E1E | Island East | 120.00 | 129.00 | 9.00 | 4.49 | 16.22 | 16.22 | 1174 |
| 1190-607-04 | E1E | Island East | 106.90 | 117.95 | 11.05 | 7.55 | 31.53 | 12.05 | 1181 |
| 1190-607-12 | E1E | Island East | 155.00 | 179.30 | 24.30 | 5.75 | 11.71 | 11.71 | 1215 |
| 1190-607-18 | E1E | Island East | 137.70 | 177.00 | 39.30 | 21.41 | 9.84 | 8.64 | 1245 |
| 1190-607-10 | E1E | Island East | 114.00 | 134.60 | 20.60 | 3.65 | 8.52 | 8.52 | 1202 |
| 1190-607-09 | E1E | Island East | 96.25 | 103.40 | 7.15 | 1.38 | 6.77 | 6.77 | 1205 |
| 945-622-08 | E1E | Island East | 500.80 | 506.20 | 5.40 | 2.41 | 5.06 | 5.06 | 1341 |
| 1190-607-05 | E1E | Island East | 97.30 | 102.25 | 4.95 | 3.11 | 4.70 | 4.70 | 1155 |
| 1190-607-02 | E1E | Island East | 99.90 | 104.15 | 4.25 | 2.76 | 3.68 | 3.68 | 1193 |
| 1190-607-03 | E1E | Island East | 104.84 | 110.11 | 5.27 | 3.53 | 3.36 | 3.36 | 1210 |
| 560-481-12 | NS1 | Island West Hanging Wall | 402.65 | 405.50 | 2.85 | 2.07 | 9.36 | 9.36 | 329 |
| 560-481-14 | NS1 | Island West Hanging Wall | 430.00 | 433.50 | 3.50 | 2.09 | 9.08 | 9.08 | 260 |
| 560-481-13 | NS1 | Island West Hanging Wall | 273.00 | 275.50 | 2.50 | 2.17 | 4.89 | 4.89 | 510 |
| 900-506-24 | NS2 | Island West Hanging Wall | 155.95 | 164.00 | 8.05 | 2.87 | 20.66 | 18.79 | 933 |
| 900-506-22 | NS2 | Island West Hanging Wall | 152.35 | 156.07 | 3.72 | 3.69 | 17.23 | 9.69 | 956 |
| 900-506-35 | NS2 | Island West Hanging Wall | 196.15 | 200.00 | 3.85 | 2.94 | 20.92 | 8.77 | 849 |
| 900-506-30 | NS2 | Island West Hanging Wall | 166.90 | 172.40 | 5.50 | 5.16 | 6.58 | 6.58 | 911 |
| 900-506-18A | NS2 | Island West Hanging Wall | 154.75 | 160.90 | 6.15 | 5.89 | 9.06 | 6.33 | 975 |
| 900-506-44 | NS2 | Island West Hanging Wall | 239.00 | 246.25 | 7.25 | 6.01 | 13.81 | 5.31 | 1054 |
| 1025-503-32 | NS2 | Island West Hanging Wall | 237.10 | 241.70 | 4.60 | 3.34 | 8.51 | 4.84 | 1059 |
| 900-506-20 | NS2 | Island West Hanging Wall | 199.35 | 201.85 | 2.50 | 2.35 | 4.43 | 4.43 | 846 |
| 900-506-27 | NS2 | Island West Hanging Wall | 152.00 | 161.00 | 9.00 | 8.80 | 4.42 | 4.42 | 939 |
| 1025-503-33 | NS2 | Island West Hanging Wall | 279.50 | 283.75 | 4.25 | 2.12 | 11.31 | 3.55 | 1124 |
| 850-475-25 | NS3 | Island West Hanging Wall | 127.70 | 131.00 | 3.30 | 2.31 | 39.98 | 12.88 | 959 |
| 790-460-36 | NS3 | Island West Hanging Wall | 275.71 | 287.57 | 11.86 | 8.00 | 58.92 | 9.93 | 1021 |
| 850-472-39 | NS3 | Island West Hanging Wall | 93.00 | 96.50 | 3.50 | 2.02 | 9.60 | 9.60 | 932 |
| 1025-492-18 | NS3 | Island West Hanging Wall | 360.90 | 365.00 | 4.10 | 3.39 | 4.73 | 4.73 | 1218 |
| 850-470-07 | NS3 | Island West Hanging Wall | 75.00 | 78.00 | 3.00 | 2.88 | 53.98 | 4.28 | 848 |
| 850-472-46 | NS3 | Island West Hanging Wall | 152.85 | 158.02 | 5.17 | 4.02 | 3.89 | 3.89 | 963 |
| 850-472-51 | NS4 | Island West Hanging Wall | 106.60 | 109.40 | 2.80 | 2.46 | 24.91 | 4.45 | 921 |
| 1025-492-02 | NS4 | Island West Hanging Wall | 354.65 | 356.80 | 2.15 | 2.07 | 10.15 | 9.19 | 1179 |
| 900-506-22 | NS4 | Island West Hanging Wall | 385.65 | 388.15 | 2.50 | 2.46 | 22.21 | 7.33 | 1012 |
| 850-472-45 | NS4 | Island West Hanging Wall | 148.00 | 152.00 | 4.00 | 3.15 | 4.52 | 4.52 | 921 |
| 1160-625-26 | NTH4 | Island East Footwall | 204.00 | 206.40 | 2.40 | 2.08 | 132.73 | 34.86 | 1042 |
| 1160-625-25 | NTH4 | Island East Footwall | 200.00 | 207.00 | 7.00 | 6.08 | 8.99 | 8.99 | 1086 |
| 1160-625-24 | NTH4 | Island East Footwall | 182.50 | 186.73 | 4.23 | 4.04 | 6.65 | 6.65 | 1070 |
| 790-460-37 | Unknown | Island West Hanging Wall | 190.42 | 198.00 | 7.58 | 9.80 | 892 | ||
| 850-472-51 | Unknown | Island West Hanging Wall | 123.00 | 131.35 | 8.35 | 8.65 | 934 | ||
| 945-624-96 | Unknown | Island East Footwall | 376.55 | 380.40 | 3.85 | 7.66 | 1231 | ||
| 1025-503-29 | Unknown | Island West Footwall | 235.70 | 238.00 | 2.30 | 5.09 | 1150 | ||
| MA25-305 | Unknown | 681.75 | 685.40 | 3.65 | 4.82 | 652 | |||
| 850-472-47 | Unknown | Island West Hanging Wall | 130.00 | 134.20 | 4.20 | 4.14 | 952 | ||
| 850-472-50 | Unknown | Island West Hanging Wall | 150.15 | 154.50 | 4.35 | 3.27 | 993 | ||
| 945-622-06A | Unknown | Island East Footwall | 532.90 | 538.70 | 5.80 | 3.18 | 1392 | ||
| Table 2: Island Gold – Previously Unreleased Select Composite Intervals from Underground and Surface Delineation Drilling C/E1E Zones Composite intervals greater than 20 gram*metre. Capping values: Island West and Island Main (C-zone) @ 230 g/t Au; Island Main and East (E1E Zone) @ 185 g/t Au. | |||||||||
| Hole ID | Zone | Target Area | From (m) | To (m) | Core Length (m) | True Width (m) | Au Uncut (g/t) | Au Cut (g/t) | Vertical Depth (m) |
| 890-461-54 | C | Island West | 113.05 | 120.95 | 7.90 | 5.56 | 21.41 | 14.77 | 920 |
| 850-472-13 | C | Island West | 143.00 | 145.35 | 2.35 | 2.00 | 10.17 | 10.17 | 920 |
| 850-470-04 | C | Island West | 178.40 | 202.10 | 23.70 | 6.92 | 3.94 | 3.94 | 1000 |
| 490-450-06 | C | Island West | 180.65 | 184.00 | 3.35 | 2.17 | 43.26 | 43.26 | 554 |
| 1025-503-20 | C | Island West | 266.00 | 269.06 | 3.06 | 2.06 | 10.96 | 10.96 | 1153 |
| 1025-503-16 | C | Island West | 226.50 | 231.90 | 5.40 | 3.07 | 10.83 | 10.83 | 1115 |
| 1025-503-12 | C | Island West | 230.50 | 233.65 | 3.15 | 2.16 | 13.08 | 13.08 | 1126 |
| MH44-03 | E1E | Island East | 1420.74 | 1424.12 | 3.38 | 2.53 | 5.36 | 5.36 | 1382 |
| MH44-02 | E1E | Island East | 1394.35 | 1400.15 | 5.80 | 4.15 | 5.20 | 5.20 | 1352 |
| MH42-03 | E1E | Island East | 1504.70 | 1524.00 | 19.30 | 17.99 | 54.85 | 39.73 | 1392 |
| MH42-02 | E1E | Island East | 1500.00 | 1505.30 | 5.30 | 5.29 | 13.55 | 13.55 | 1377 |
| MH41-03 | E1E | Island East | 1518.30 | 1522.95 | 4.65 | 4.08 | 60.00 | 57.81 | 1427 |
| MH41-01 | E1E | Island East | 1468.70 | 1477.90 | 9.20 | 7.05 | 56.05 | 35.02 | 1363 |
| 945-624-99 | E1E | Island East | 228.00 | 233.00 | 5.00 | 3.70 | 7.03 | 7.03 | 1104 |
| 945-624-95 | E1E | Island East | 450.00 | 458.15 | 8.15 | 4.58 | 9.28 | 9.28 | 1305 |
| 945-624-88 | E1E | Island East | 323.70 | 328.90 | 5.20 | 2.86 | 11.52 | 11.52 | 1219 |
| 945-624-87 | E1E | Island East | 388.30 | 394.65 | 6.35 | 2.43 | 87.63 | 46.48 | 1305 |
| 945-624-78 | E1E | Island East | 353.50 | 382.70 | 29.20 | 13.09 | 5.88 | 5.88 | 1268 |
| 945-624-75 | E1E | Island East | 230.60 | 247.25 | 16.65 | 14.72 | 5.27 | 5.27 | 1119 |
| 945-624-68 | E1E | Island East | 323.50 | 326.70 | 3.20 | 2.10 | 26.28 | 26.28 | 1212 |
| 945-622-07 | E1E | Island East | 563.00 | 568.20 | 5.20 | 2.91 | 13.76 | 13.76 | 1386 |
| 945-622-03 | E1E | Island East | 341.10 | 347.35 | 6.25 | 2.99 | 18.64 | 12.88 | 1242 |
| 945-622-02 | E1E | Island East | 388.10 | 395.05 | 6.95 | 4.00 | 8.70 | 8.70 | 1279 |
| 1190-607-19 | E1E | Island East | 121.40 | 139.90 | 18.50 | 4.65 | 6.86 | 6.86 | 1218 |
| 1190-607-09 | E1E | Island East | 196.90 | 203.50 | 6.60 | 3.44 | 18.71 | 14.89 | 1253 |
| 1190-607-09 | E1E | Island East | 157.05 | 165.50 | 8.45 | 4.15 | 7.31 | 7.31 | 1234 |
| 1190-607-08 | E1E | Island East | 125.85 | 158.30 | 32.45 | 17.50 | 4.11 | 4.11 | 1203 |
| 1190-607-03 | E1E | Island East | 127.77 | 149.38 | 21.61 | 12.18 | 4.09 | 4.09 | 1226 |
| 1160-625-29 | E1E | Island East | 153.13 | 174.00 | 20.87 | 10.15 | 4.49 | 4.49 | 1186 |
| 1160-625-15 | E1E | Island East | 201.00 | 205.00 | 4.00 | 2.11 | 48.31 | 47.68 | 1253 |
| Table 3: Island Gold Regional Exploration – Previously Unreleased Select Composite Intervals from 2025 Surface Exploration Drilling at Cline-Pick and Edwards. Composite intervals greater than 4 g*m All reported composite intervals reported as uncut, and composites lengths are reported as core length. True width is estimated to be 40 to 85% of core length, unless otherwise noted (i.e. 25IGX128). Composites are calculated with a 0.5 g/t cut-off, maximum internal waste of 4.0 m, and no minimum length. | |||||||
| Hole ID | Zone | Target Area | From (m) | To (m) | Core Length (m) | Au Uncut (g/t) | Vertical Depth (m) |
| 25IGX110 | Pick | 61.69 | 68.32 | 6.63 | 6.07 | 45.79 | |
| including | 62.14 | 62.94 | 0.80 | 32.70 | |||
| including | 64.83 | 65.30 | 0.47 | 19.10 | |||
| 25IGX111 | Pick | 100.92 | 106.34 | 5.42 | 1.88 | 97.21 | |
| including | 105.56 | 105.92 | 0.36 | 16.15 | |||
| and | 201.30 | 204.98 | 3.68 | 4.79 | 187.87 | ||
| including | 202.97 | 203.39 | 0.42 | 37.30 | |||
| 25IGX112 | Pick | 181.05 | 189.82 | 8.77 | 1.62 | ||
| including | 183.55 | 184.12 | 0.57 | 10.15 | |||
| and | 250.18 | 258.97 | 8.79 | 12.75 | 176.56 | ||
| including | 250.18 | 251.19 | 1.01 | 93.75 | |||
| and | 296.00 | 300.00 | 4.00 | 2.66 | |||
| 25IGX113 | Pick | 149.05 | 150.03 | 0.98 | 12.70 | 129.19 | |
| 25IGX114A | Pick | 131.00 | 137.91 | 6.91 | 4.62 | 123.22 | |
| including | 135.59 | 136.44 | 0.85 | 15.30 | |||
| and | 252.86 | 253.20 | 0.34 | 18.75 | 230.72 | ||
| 25IGX115 | Pick | 298.05 | 310.23 | 12.18 | 2.36 | 285.55 | |
| including | 298.05 | 298.71 | 0.66 | 26.50 | |||
| 25IGX116 | Pick | 259.90 | 275.50 | 15.60 | 1.57 | 241.71 | |
| and | 299.65 | 300.00 | 0.35 | 11.50 | |||
| 25IGX117 | Pick | 42.80 | 43.44 | 0.64 | 16.95 | 31.26 | |
| and | 201.93 | 234.23 | 32.30 | 1.29 | 157.03 | ||
| 25IGX118 | Pick | 243.51 | 247.84 | 4.33 | 2.65 | 202.00 | |
| 25IGX119 | Pick | 297.35 | 300.98 | 3.63 | 5.53 | 287.87 | |
| including | 299.38 | 300.55 | 1.17 | 11.10 | |||
| and | 345.48 | 348.84 | 3.36 | 6.34 | 329.85 | ||
| including | 347.40 | 348.53 | 1.13 | 17.78 | |||
| and | 353.13 | 358.41 | 5.28 | 3.75 | 337.37 | ||
| including | 356.92 | 358.41 | 1.49 | 12.05 | |||
| 25IGX120 | Pick | 319.74 | 323.50 | 3.76 | 2.68 | 379.64 | |
| 25IGX121 | Pick | 359.58 | 360.16 | 0.58 | 23.00 | 356.57 | |
| 25IGX122 | Pick | 255.24 | 260.22 | 4.98 | 2.23 | 188.27 | |
| including | 258.90 | 259.31 | 0.41 | 18.35 | |||
| 25IGX123 | Pick | Assays Pending | |||||
| 25IGX124 | Pick | 150.17 | 152.51 | 2.34 | 23.57 | 109.20 | |
| including | 151.68 | 152.13 | 0.45 | 115.00 | |||
| 25IGX125 | Pick | Assays Pending | |||||
| 25IGX126A | Pick | 319.12 | 319.42 | 0.30 | 23.40 | 268.90 | |
| and | 413.92 | 416.78 | 2.86 | 3.66 | 346.90 | ||
| including | 413.92 | 414.42 | 0.50 | 19.35 | |||
| 25IGX127B | Pick | 418.28 | 425.00 | 6.72 | 2.80 | 296.10 | |
| Including | 424.30 | 425.00 | 0.70 | 17.25 | |||
| and | 444.25 | 451.85 | 7.60 | 1.64 | 313.35 | ||
| 25IGX128 | Pick | 517.30 | 535.66 | 18.36 | 2.41 | 407.00 | |
| including | 526.69 | 527.07 | 0.38 | 24.00 | |||
| including | 531.00 | 531.30 | 0.30 | 34.40 | |||
| and | 542.90 | 548.42 | 5.52 | 15.28 | 423.10 | ||
| including | 542.90 | 543.45 | 0.55 | 15.10 | |||
| including | 543.45 | 544.35 | 0.90 | 10.60 | |||
| including | 544.35 | 545.10 | 0.75 | 12.35 | |||
| including | 545.57 | 546.00 | 0.43 | 18.35 | |||
| including | 546.00 | 546.66 | 0.66 | 25.20 | |||
| including | 547.48 | 547.83 | 0.35 | 19.15 | |||
| including | 547.83 | 548.42 | 0.59 | 40.30 | |||
| and | 555.00 | 558.54 | 3.54 | 178.07 | 433.70 | ||
| including | 555.00 | 555.70 | 0.70 | 219.00 | |||
| including | 555.70 | 556.38 | 0.68 | 301.00 | |||
| including | 556.38 | 557.00 | 0.62 | 295.00 | |||
| including | 557.00 | 557.50 | 0.50 | 112.50 | |||
| including | 557.50 | 558.05 | 0.55 | 25.30 | |||
| including | 558.05 | 558.54 | 0.49 | 39.40 | |||
| 25IGX132 | Edwards | Assays Pending | |||||
| 25IGX133 | Edwards | Assays Pending | |||||
| Table 4: Island Gold surface and underground exploration and delineation drill holes; azimuth, dip, drilled length, and collar location at surface (UTM NAD83). | ||||||
| Hole ID | Azimuth (°) | Dip (°) | Drilled Length (m) | UTM Easting (m) | UTM Northing (m) | UTM Elevation (m) |
| MH45-01 | 354.0 | -81.0 | 1600.0 | 692071.9 | 5351269.0 | 395.0 |
| MH44-03 | 349.0 | -86.0 | 1534.0 | 691642.2 | 5351374.9 | 398.8 |
| MH44-02 | 349.0 | -86.0 | 1461.0 | 691642.2 | 5351374.9 | 398.8 |
| MH42-03 | 334.0 | -80.0 | 1691.0 | 692200.1 | 5351227.6 | 397.2 |
| MH42-02 | 334.0 | -80.1 | 1605.0 | 692200.1 | 5351227.6 | 397.2 |
| MH42-01 | 334.0 | -80.0 | 1641.0 | 692200.1 | 5351227.6 | 397.2 |
| MH41-03 | 342.0 | -78.2 | 1584.0 | 692214.7 | 5351234.2 | 397.2 |
| MH41-01 | 342.0 | -78.0 | 1669.0 | 692214.7 | 5351234.2 | 397.2 |
| MA25-305 | 352.0 | -73.6 | 1051.0 | 689588.0 | 5350980.5 | 382.0 |
| 945-624-99 | 28.1 | -50.5 | 279.0 | 691897.0 | 5351741.7 | -537.8 |
| 945-624-96 | 59.4 | -53.0 | 417.0 | 691897.9 | 5351739.9 | -537.8 |
| 945-624-95 | 79.0 | -52.0 | 516.0 | 691898.2 | 5351739.1 | -537.9 |
| 945-624-94 | 86.5 | -61.9 | 537.0 | 691898.0 | 5351738.8 | -537.9 |
| 945-624-88 | 60.1 | -64.2 | 423.0 | 691897.7 | 5351740.1 | -537.9 |
| 945-624-87 | 57.9 | -77.7 | 420.0 | 691897.3 | 5351740.1 | -537.9 |
| 945-624-78 | 65.1 | -68.9 | 408.0 | 691897.6 | 5351740.1 | -538.0 |
| 945-624-75 | 32.0 | -56.2 | 300.0 | 691896.9 | 5351741.4 | -538.0 |
| 945-624-68 | 63.5 | -60.9 | 393.0 | 691898.0 | 5351739.7 | -537.9 |
| 945-622-08 | 250.2 | -52.1 | 552.0 | 691891.5 | 5351739.8 | -537.8 |
| 945-622-07 | 245.0 | -50.0 | 606.0 | 691891.6 | 5351739.5 | -537.9 |
| 945-622-06A | 241.5 | -58.3 | 645.0 | 691891.7 | 5351739.7 | -538.9 |
| 945-622-06A | 241.5 | -58.3 | 645.0 | 691891.7 | 5351739.7 | -538.9 |
| 945-622-03 | 269.3 | -66.1 | 468.0 | 691891.5 | 5351740.2 | -538.0 |
| 945-622-02 | 253.0 | -64.9 | 513.0 | 691891.9 | 5351739.5 | -537.9 |
| 900-506-44 | 163.9 | -31.0 | 270.0 | 690683.4 | 5351595.0 | -541.6 |
| 900-506-35 | 223.6 | 18.2 | 432.0 | 690681.8 | 5351595.8 | -539.8 |
| 900-506-30 | 205.6 | 3.2 | 186.0 | 690682.0 | 5351595.4 | -540.4 |
| 900-506-27 | 202.1 | -5.4 | 192.0 | 690682.3 | 5351595.1 | -540.7 |
| 900-506-24 | 173.2 | -3.2 | 255.0 | 690683.5 | 5351595.1 | -540.6 |
| 900-506-23 | 235.9 | 19.5 | 228.0 | 690680.9 | 5351597.0 | -539.6 |
| 900-506-22 | 222.5 | -11.5 | 436.0 | 690681.6 | 5351596.2 | -540.9 |
| 900-506-20 | 214.9 | 19.3 | 207.0 | 690681.4 | 5351596.3 | -539.8 |
| 900-506-19 | 198.0 | 1.2 | 195.0 | 690681.6 | 5351596.0 | -540.4 |
| 900-506-18A | 199.9 | -19.0 | 195.0 | 690682.3 | 5351595.1 | -541.2 |
| 890-461-54 | 183.5 | -27.4 | 210.0 | 690217.0 | 5351519.3 | -483.2 |
| 890-461-53 | 187.1 | -20.3 | 168.0 | 690216.7 | 5351519.2 | -483.0 |
| 850-475-25 | 289.3 | -57.3 | 204.0 | 690419.9 | 5351406.2 | -467.6 |
| 850-472-51 | 206.1 | -41.5 | 249.0 | 690402.8 | 5351371.9 | -466.5 |
| 850-472-50 | 198.4 | -71.2 | 207.0 | 690403.3 | 5351371.8 | -466.8 |
| 850-472-47 | 231.0 | -51.4 | 165.0 | 690402.3 | 5351373.0 | -466.7 |
| 850-472-46 | 258.9 | -43.8 | 180.9 | 690401.9 | 5351374.1 | -466.4 |
| 850-472-45 | 256.9 | -26.2 | 165.0 | 690401.8 | 5351373.9 | -465.9 |
| 850-472-43 | 298.2 | -46.6 | 240.0 | 690402.8 | 5351375.8 | -466.5 |
| 850-472-39 | 291.3 | -60.2 | 318.0 | 690403.3 | 5351375.7 | -466.7 |
| 850-472-38 | 295.3 | -56.2 | 312.0 | 690403.2 | 5351375.9 | -466.7 |
| 850-472-34 | 323.2 | -67.4 | 240.0 | 690404.7 | 5351376.2 | -466.7 |
| 850-472-13 | 324.8 | -28.1 | 195.0 | 690403.6 | 5351376.1 | -465.9 |
| 850-470-07 | 214.3 | 0.9 | 165.0 | 690355.0 | 5351454.5 | -467.7 |
| 850-470-04 | 243.9 | -51.1 | 252.0 | 690354.6 | 5351457.5 | -469.0 |
| 790-460-37 | 169.7 | -20.3 | 240.0 | 690191.0 | 5351552.4 | -434.2 |
| 790-460-36 | 153.9 | -44.2 | 309.0 | 690191.9 | 5351552.8 | -435.0 |
| 790-460-15 | 171.7 | -13.9 | 144.0 | 690191.2 | 5351552.4 | -434.0 |
| 560-481-16 | 230.4 | 29.9 | 441.0 | 690408.1 | 5351582.0 | -166.5 |
| 560-481-14 | 233.7 | 33.7 | 456.0 | 690408.0 | 5351581.9 | -166.1 |
| 560-481-13 | 237.8 | 6.2 | 333.0 | 690408.2 | 5351582.6 | -168.1 |
| 560-481-12 | 238.3 | 28.9 | 453.0 | 690408.0 | 5351582.3 | -166.5 |
| 490-450-06 | 216.2 | -21.1 | 447.0 | 690071.0 | 5351599.9 | -100.3 |
| 490-450-05 | 217.0 | 2.3 | 450.0 | 690070.8 | 5351599.8 | -99.3 |
| 1190-607-19 | 144.1 | -28.0 | 213.0 | 691673.2 | 5351859.7 | -774.4 |
| 1190-607-18 | 147.2 | -32.9 | 222.0 | 691673.1 | 5351859.7 | -774.6 |
| 1190-607-13 | 222.3 | -7.2 | 234.0 | 691669.8 | 5351859.7 | -773.9 |
| 1190-607-12 | 222.1 | -20.0 | 354.0 | 691671.6 | 5351859.7 | -774.1 |
| 1190-607-10 | 140.1 | -22.2 | 207.0 | 691673.8 | 5351859.9 | -774.1 |
| 1190-607-09 | 128.5 | -28.9 | 216.0 | 691674.4 | 5351860.0 | -774.4 |
| 1190-607-09 | 130.6 | -28.9 | 216.0 | 691674.4 | 5351860.0 | -774.4 |
| 1190-607-08 | 126.3 | -19.0 | 195.0 | 691674.6 | 5351859.9 | -774.2 |
| 1190-607-05 | 212.3 | 0.1 | 219.0 | 691670.2 | 5351859.7 | -773.7 |
| 1190-607-04 | 209.5 | -13.1 | 270.0 | 691670.6 | 5351859.5 | -774.1 |
| 1190-607-03 | 185.2 | -30.1 | 210.0 | 691671.6 | 5351859.6 | -774.4 |
| 1190-607-03 | 185.2 | -30.1 | 210.0 | 691671.6 | 5351859.6 | -774.4 |
| 1190-607-02 | 191.2 | -20.1 | 165.0 | 691671.3 | 5351859.7 | -774.2 |
| 1160-625-29 | 121.2 | -19.9 | 249.0 | 691853.2 | 5351912.6 | -747.7 |
| 1160-625-27 | 106.9 | 17.9 | 153.0 | 691853.6 | 5351913.3 | -746.1 |
| 1160-625-26 | 62.5 | 24.3 | 279.0 | 691853.9 | 5351914.8 | -746.0 |
| 1160-625-25 | 55.1 | 11.5 | 246.0 | 691853.8 | 5351915.2 | -746.4 |
| 1160-625-24 | 43.2 | 17.0 | 198.0 | 691853.5 | 5351915.5 | -746.1 |
| 1160-625-22 | 113.1 | 14.2 | 168.0 | 691852.3 | 5351912.3 | -746.3 |
| 1160-625-15 | 149.7 | -35.0 | 249.0 | 691850.7 | 5351911.5 | -748.0 |
| 1160-625-08 | 117.0 | 2.9 | 147.0 | 691852.1 | 5351912.2 | -746.7 |
| 1025-503-33 | 157.8 | -26.2 | 336.0 | 690624.2 | 5351662.8 | -610.1 |
| 1025-503-32 | 163.7 | -15.9 | 273.0 | 690624.2 | 5351662.7 | -609.7 |
| 1025-503-29 | 156.4 | -40.0 | 309.0 | 690624.8 | 5351662.9 | -610.7 |
| 1025-503-26 | 131.7 | -28.4 | 354.0 | 690625.4 | 5351663.0 | -610.2 |
| 1025-503-21 | 181.8 | -35.2 | 339.0 | 690623.6 | 5351662.6 | -610.4 |
| 1025-503-20 | 151.2 | -35.1 | 303.0 | 690625.0 | 5351662.9 | -610.5 |
| 1025-503-16 | 156.7 | -29.6 | 273.0 | 690624.3 | 5351662.8 | -610.2 |
| 1025-503-12 | 166.0 | -33.0 | 339.0 | 690624.1 | 5351662.8 | -610.3 |
| 1025-497-42 | 191.0 | 16.5 | 192.0 | 690565.5 | 5351645.7 | -607.4 |
| 1025-492-23 | 182.9 | -44.9 | 441.0 | 690509.9 | 5351628.5 | -607.8 |
| 1025-492-18 | 196.9 | -32.8 | 426.0 | 690509.9 | 5351628.5 | -607.8 |
| 1025-492-07 | 213.4 | -29.0 | 384.0 | 690509.9 | 5351628.5 | -607.8 |
| 1025-492-06 | 218.0 | -22.7 | 372.0 | 690509.9 | 5351628.5 | -607.8 |
| 1025-492-02 | 198.9 | -29.4 | 393.0 | 690509.9 | 5351628.5 | -607.8 |
Note: UTM mine surface elevation 393 m
| Table 5: Surface regional exploration drill holes; azimuth, dip, drilled length, and collar location at surface (UTM NAD83). | ||||||
| Hole ID | Azimuth (°) | Dip (°) | Drilled Length (m) | UTM Easting (m) | UTM Northing (m) | UTM Elevation (m) |
| 25IGX110 | 180.1 | -45.1 | 292.9 | 696034.6 | 5355085.6 | 411.5 |
| 25IGX111 | 2.2 | -68.2 | 348.0 | 696418.7 | 5355005.8 | 418.0 |
| 25IGX112 | 359.0 | -45.0 | 300.0 | 696484.3 | 5354985.0 | 418.0 |
| 25IGX113 | 2.2 | -60.2 | 354.0 | 696484.5 | 5354984.3 | 418.0 |
| 25IGX114A | 4.1 | -67.0 | 342.0 | 696484.8 | 5354984.2 | 418.3 |
| 25IGX115 | 4.1 | -70.2 | 396.0 | 696528.1 | 5354980.3 | 419.2 |
| 25IGX116 | 4.0 | -65.0 | 394.5 | 696528.1 | 5354980.3 | 419.2 |
| 25IGX117 | 1.1 | -46.1 | 291.0 | 696657.8 | 5354942.9 | 414.5 |
| 25IGX118 | 1.0 | -56.1 | 318.0 | 696657.4 | 5354942.4 | 413.2 |
| 25IGX119 | 0.5 | -63.7 | 435.0 | 696563.7 | 5354909.3 | 412.5 |
| 25IGX120 | 0.0 | -67.0 | 498.0 | 696563.7 | 5354909.2 | 412.4 |
| 25IGX121 | 191.2 | -60.4 | 477.0 | 696728.0 | 5355232.9 | 428.6 |
| 25IGX122 | 231.6 | -51.0 | 387.0 | 696639.9 | 5355278.4 | 418.9 |
| 25IGX123 | 0.9 | -51.8 | 354.0 | 696196.8 | 5354993.9 | 408.1 |
| 25IGX124 | 355.1 | -46.6 | 327.0 | 696476.6 | 5355019.4 | 416.8 |
| 25IGX125 | 214.6 | -46.4 | 312.0 | 696727.4 | 5355231.9 | 427.2 |
| 25IGX126A | 351.5 | -59.5 | 504.6 | 696476.4 | 5354848.0 | 409.8 |
| 25IGX127B | 166.9 | -50.1 | 543.0 | 696395.6 | 5355372.5 | 403.4 |
| 25IGX128 | 203.5 | -54.7 | 565.7 | 696770.8 | 5355357.5 | 413.2 |
| 25IGX129 | 180.0 | -45.0 | 327.0 | 693177.0 | 5355827.3 | 399.3 |
| 25IGX130 | 180.1 | -45.0 | 303.0 | 693487.6 | 5355759.8 | 393.7 |
| 25IGX131 | 209.9 | -47.0 | 339.0 | 694199.5 | 5355800.6 | 401.1 |
| 25IGX132 | 38.0 | -47.0 | 202.6 | 695944.0 | 5354803.9 | 407.1 |
| 25IGX133 | 28.9 | -45.0 | 192.0 | 695944.0 | 5354803.9 | 407.1 |
Figure 1: Island Gold Mine – C/E1E Longitudinal: New Underground Exploration Drilling Highlights
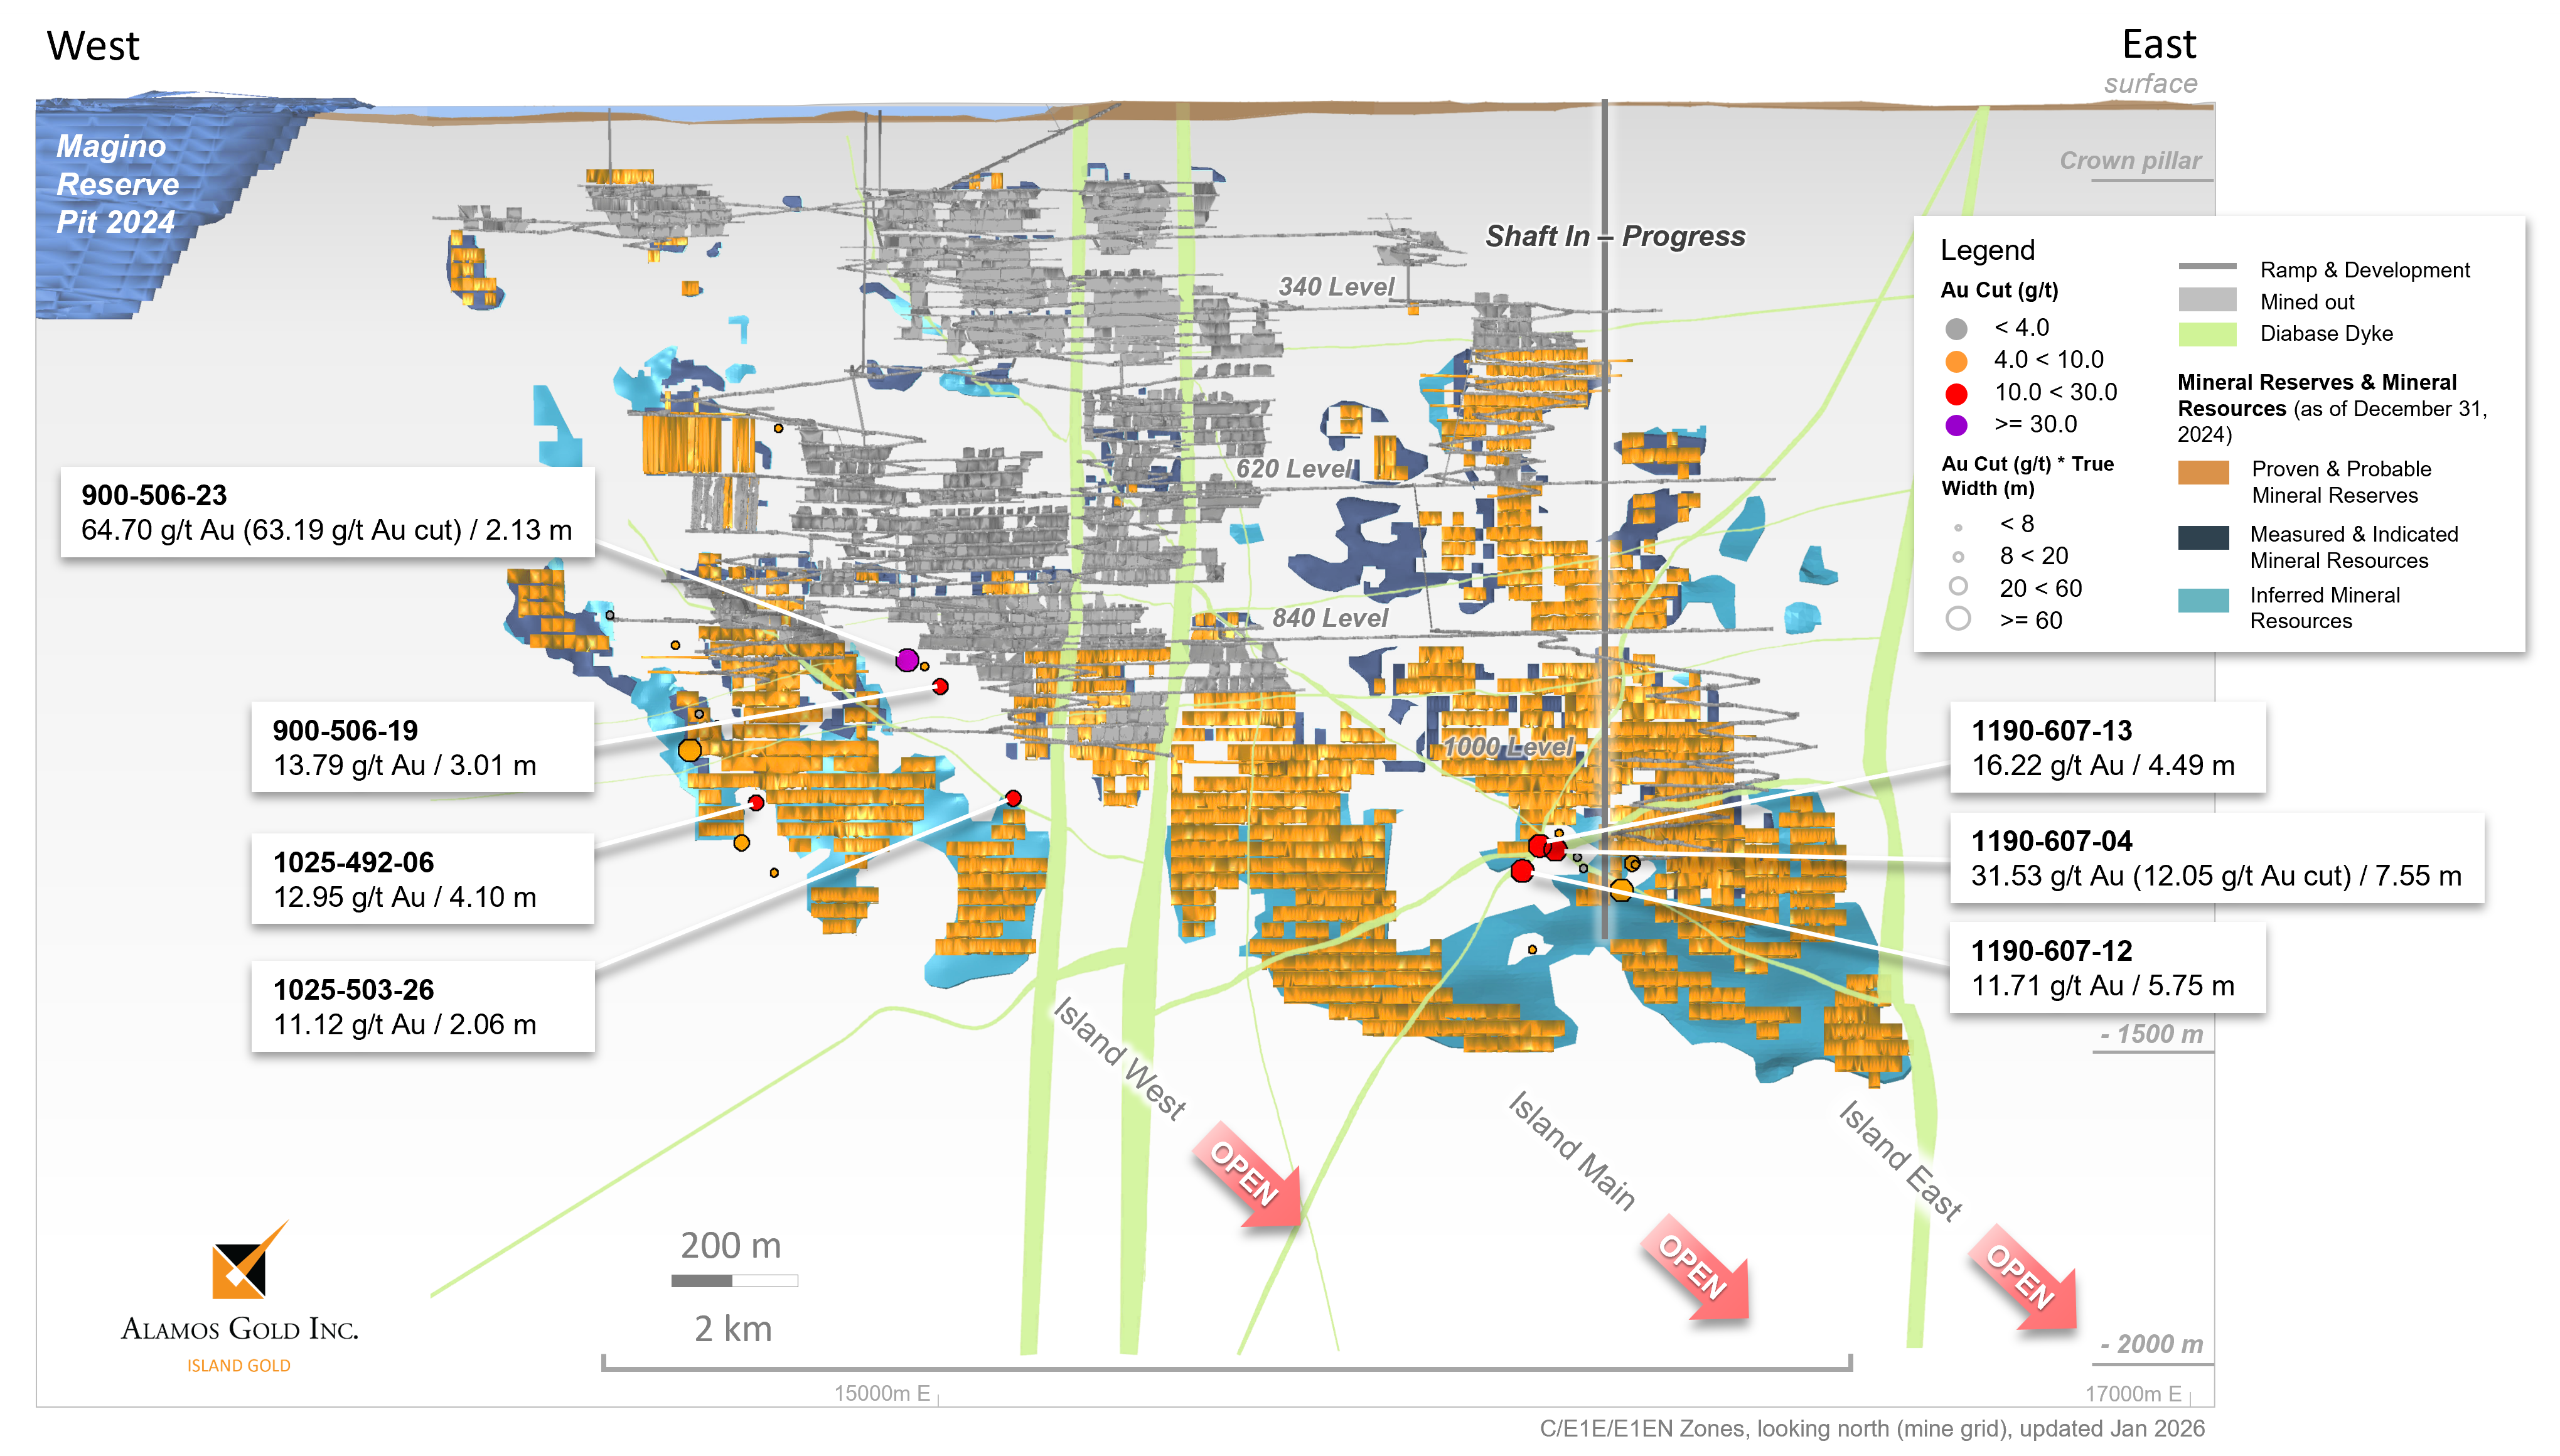
Figure 2: Island Gold Mine – New Underground Exploration Drilling Highlights: Hanging Wall & Footwall Zones
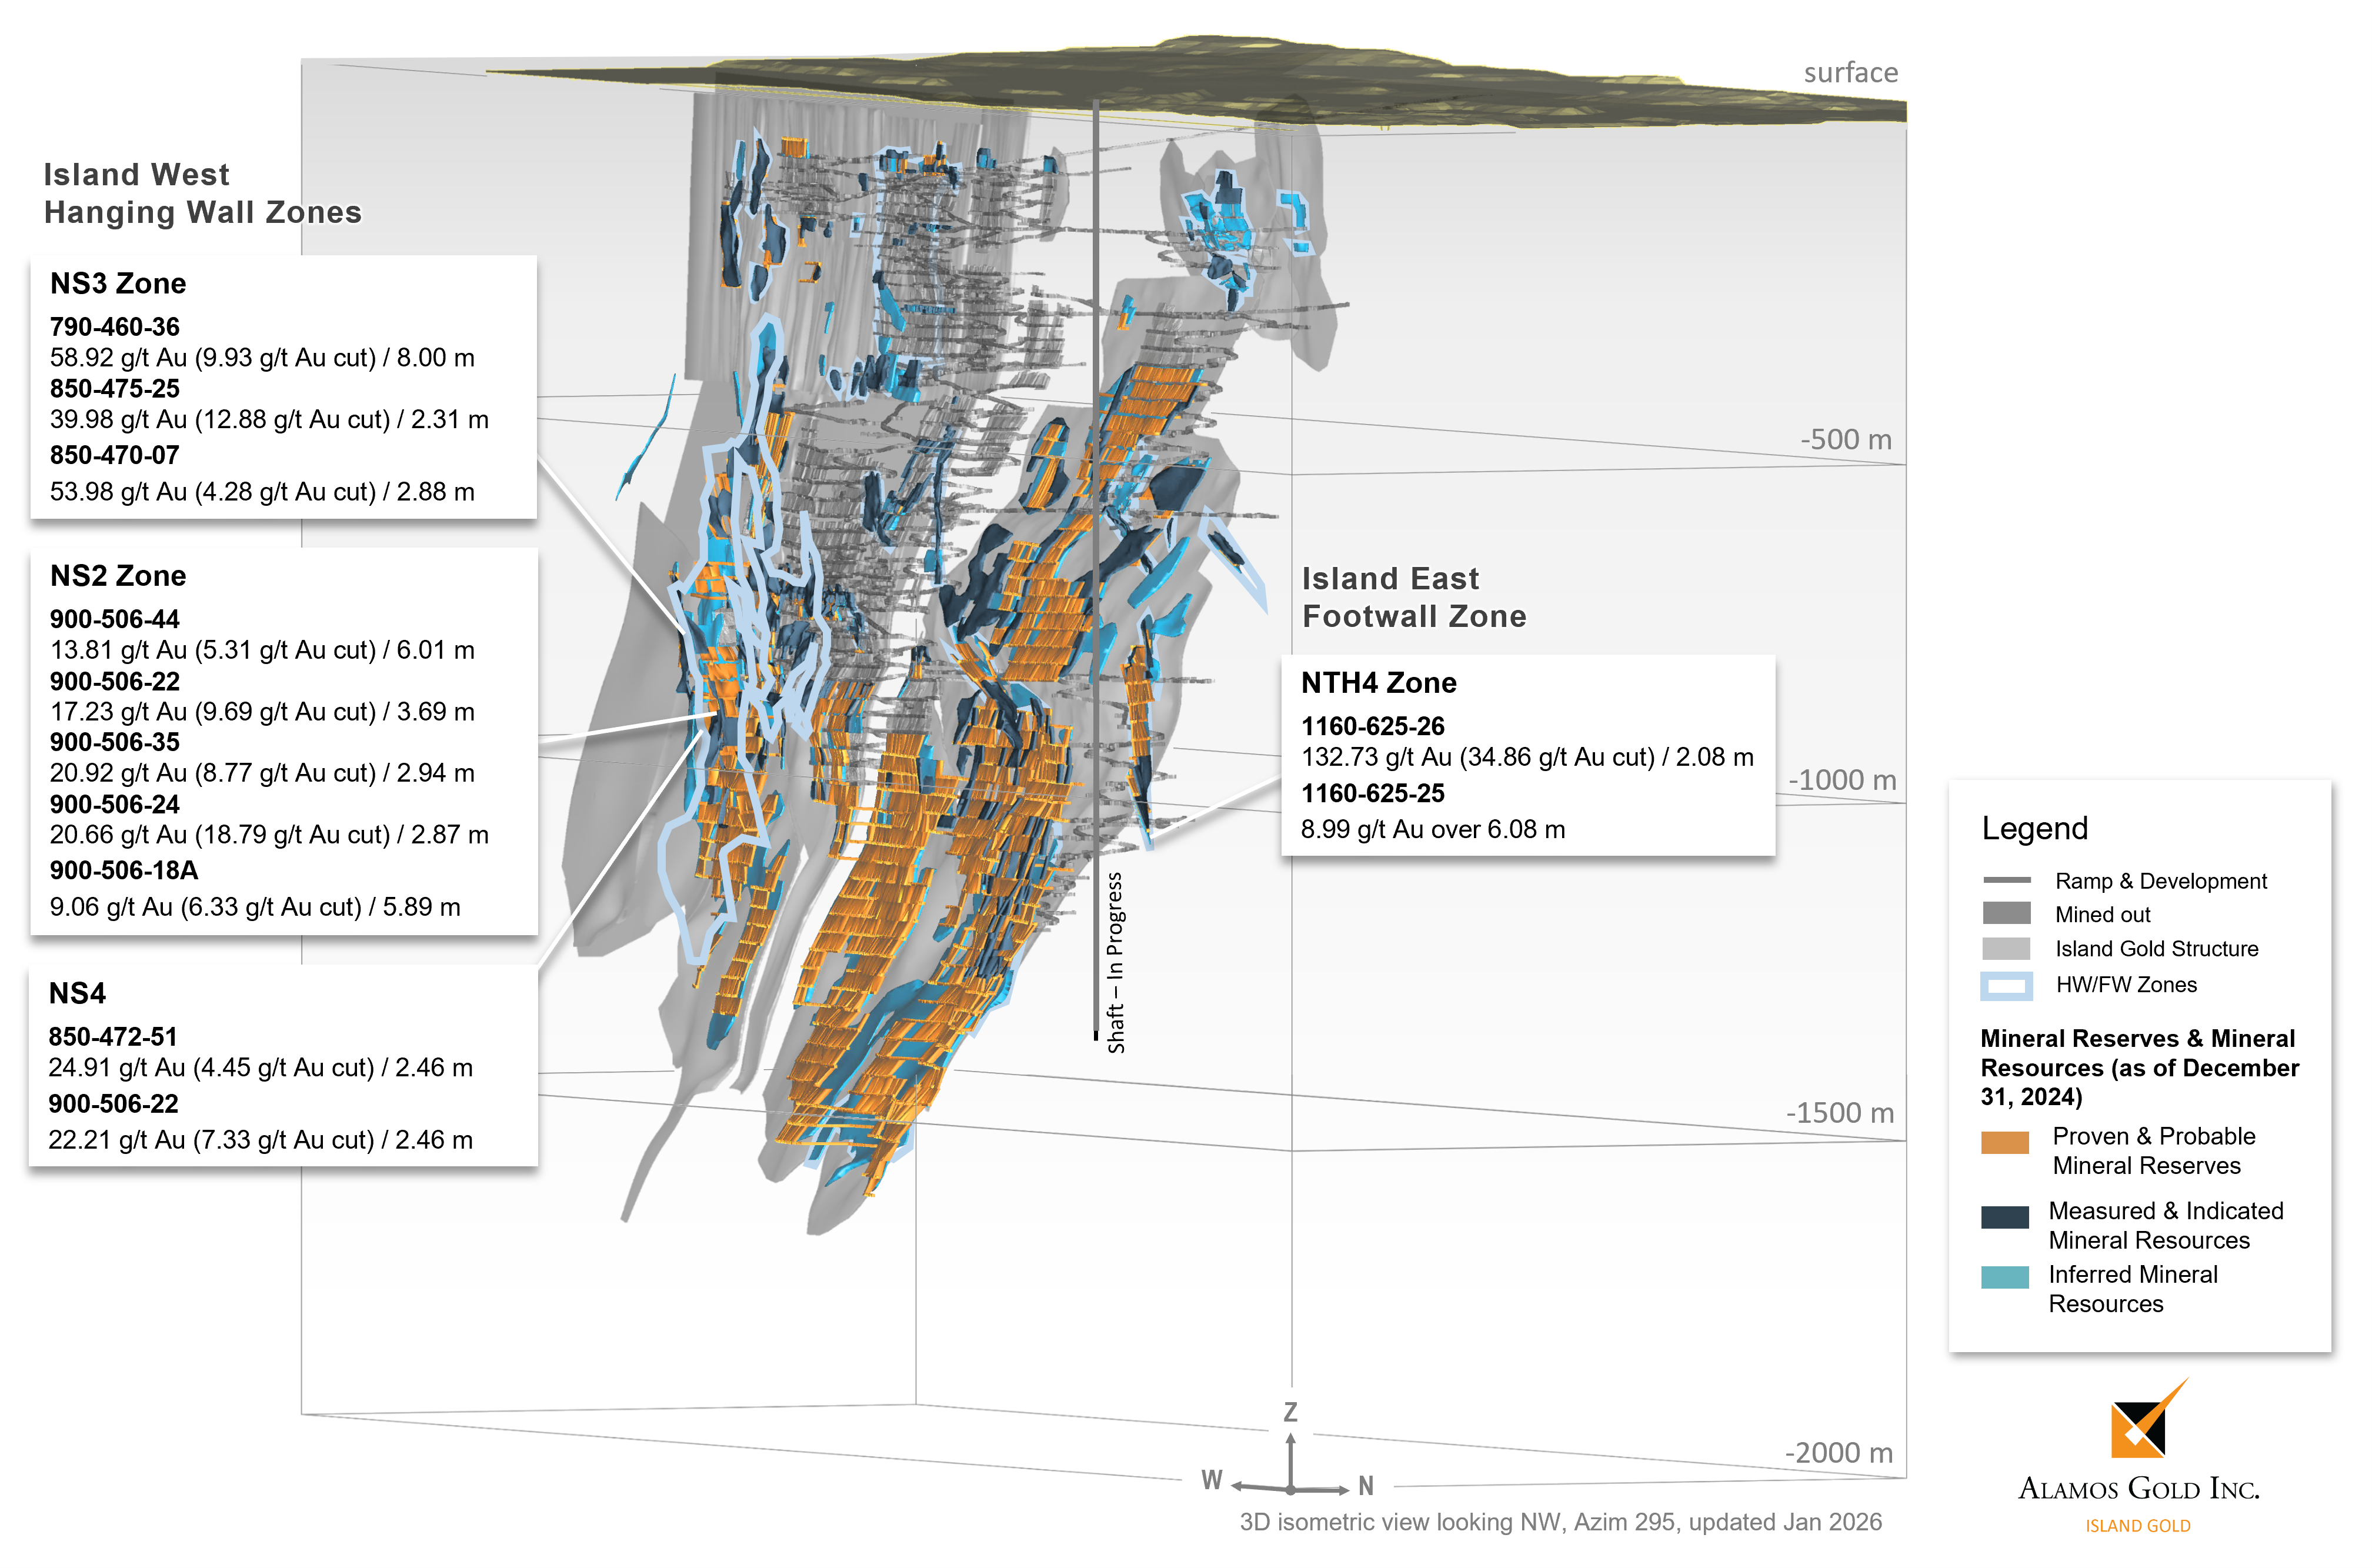
Figure 3: Island Gold Mine – C/E1E Longitudinal: New Surface & Underground Delineation Drilling Highlights
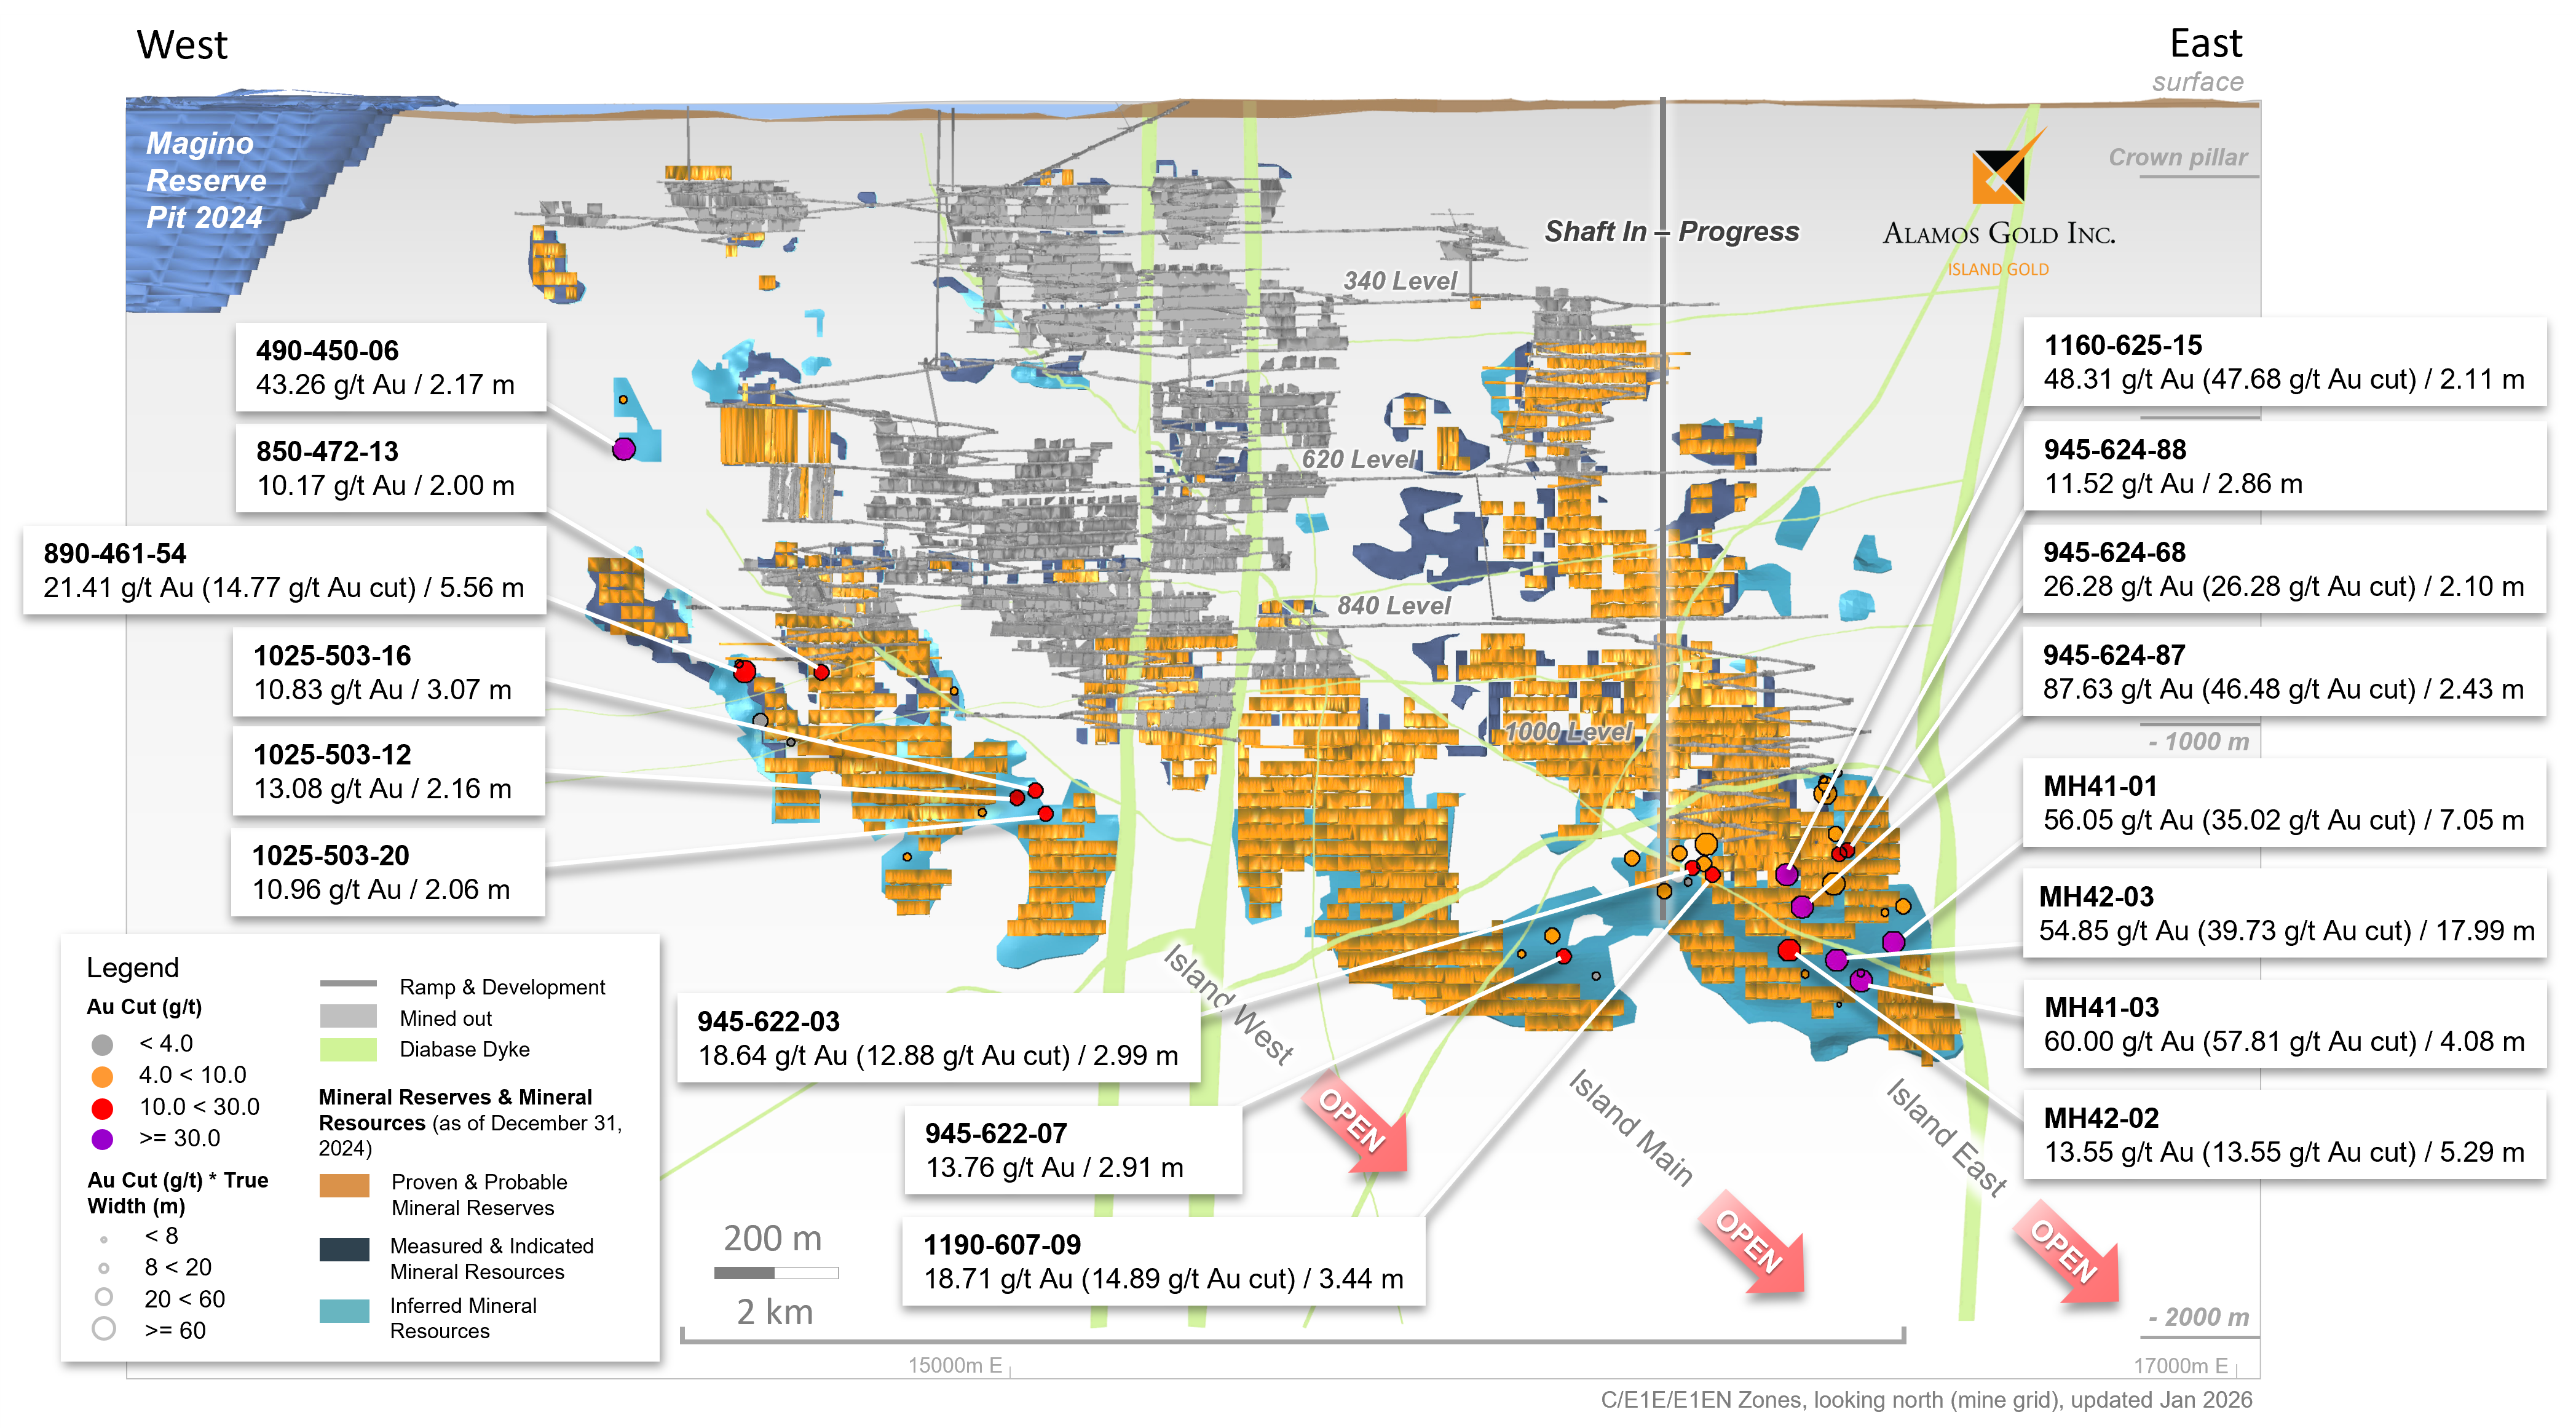
Figure 4: Location Map – Island Gold District Regional Exploration – Cline-Pick & Edwards Mines
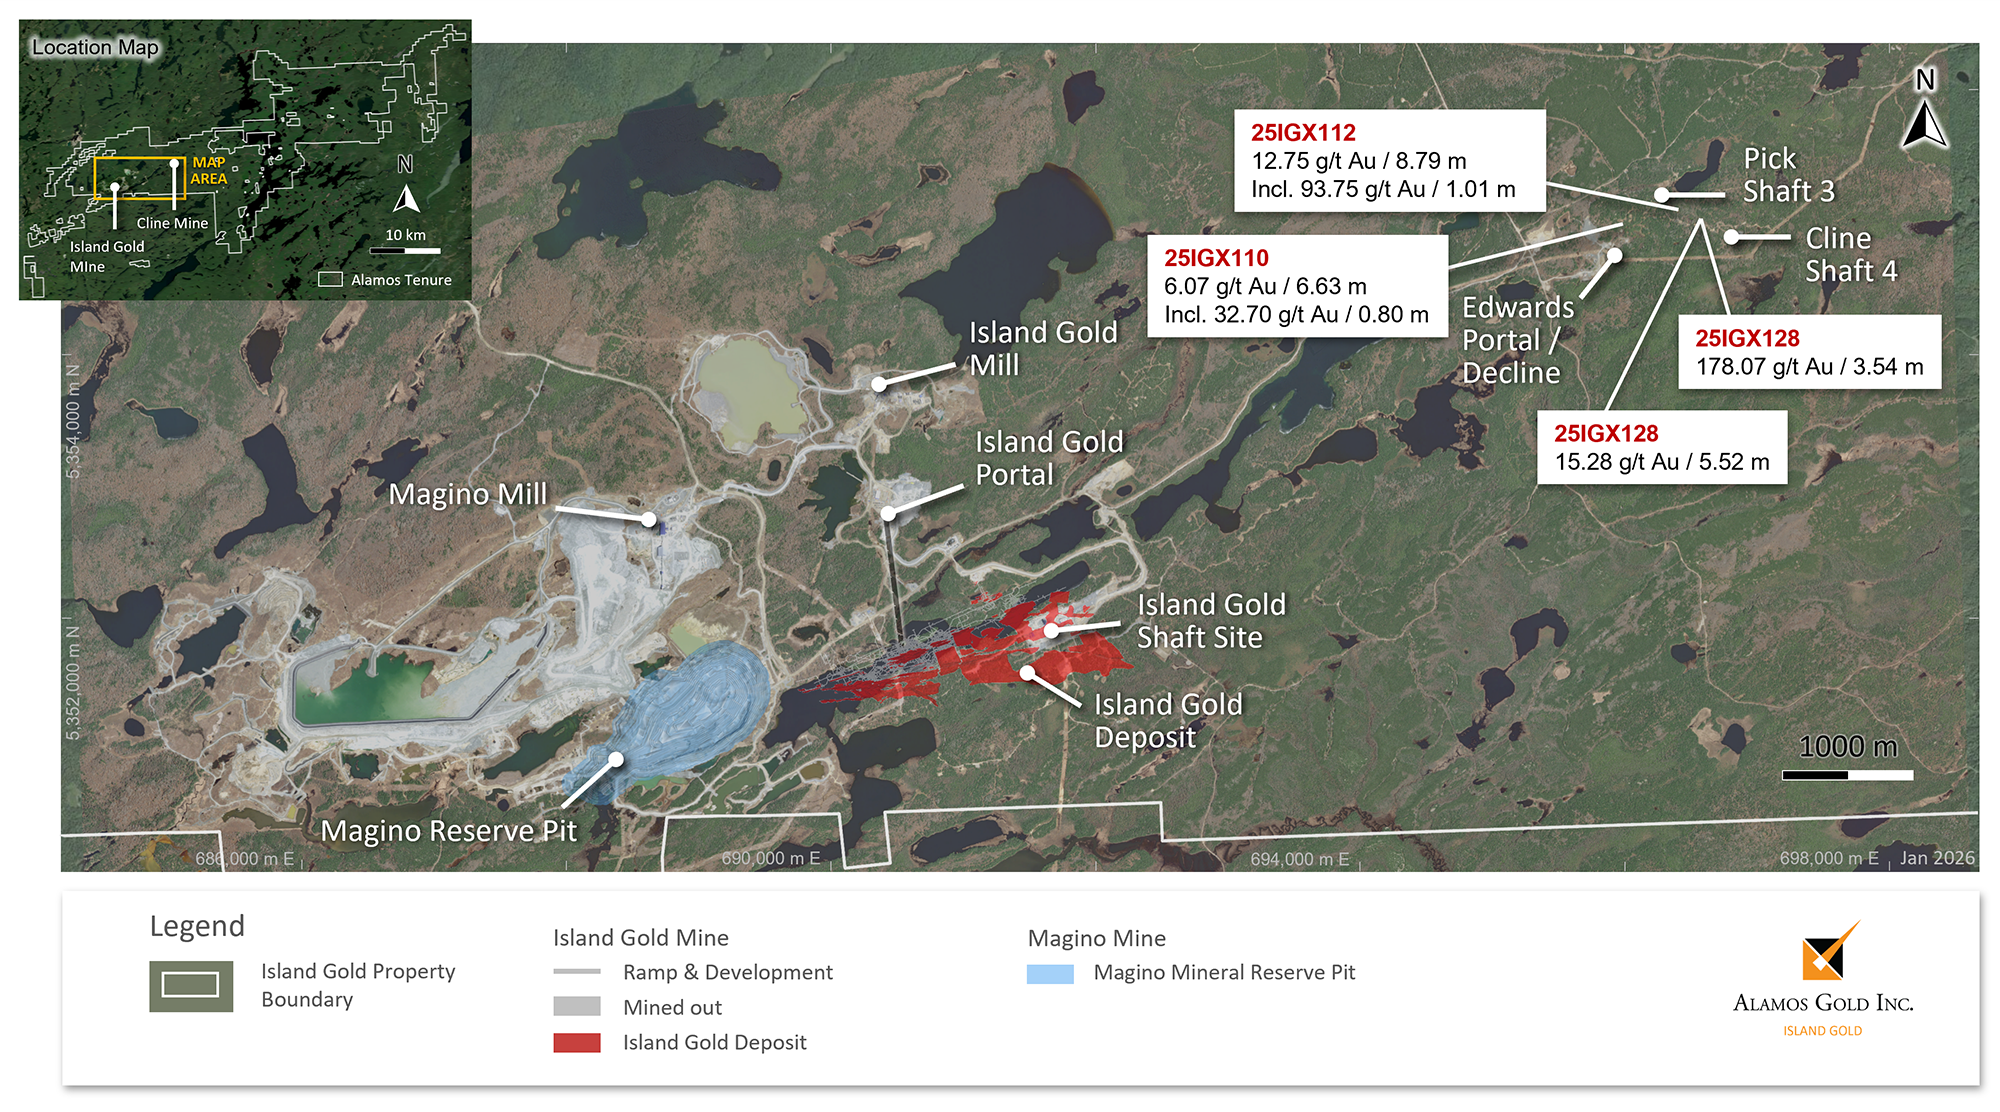
Figure 5: Cline-Pick Mines Plan Map with Current and Historic Drilling
A-A’ cross section reference (see Figure 6)
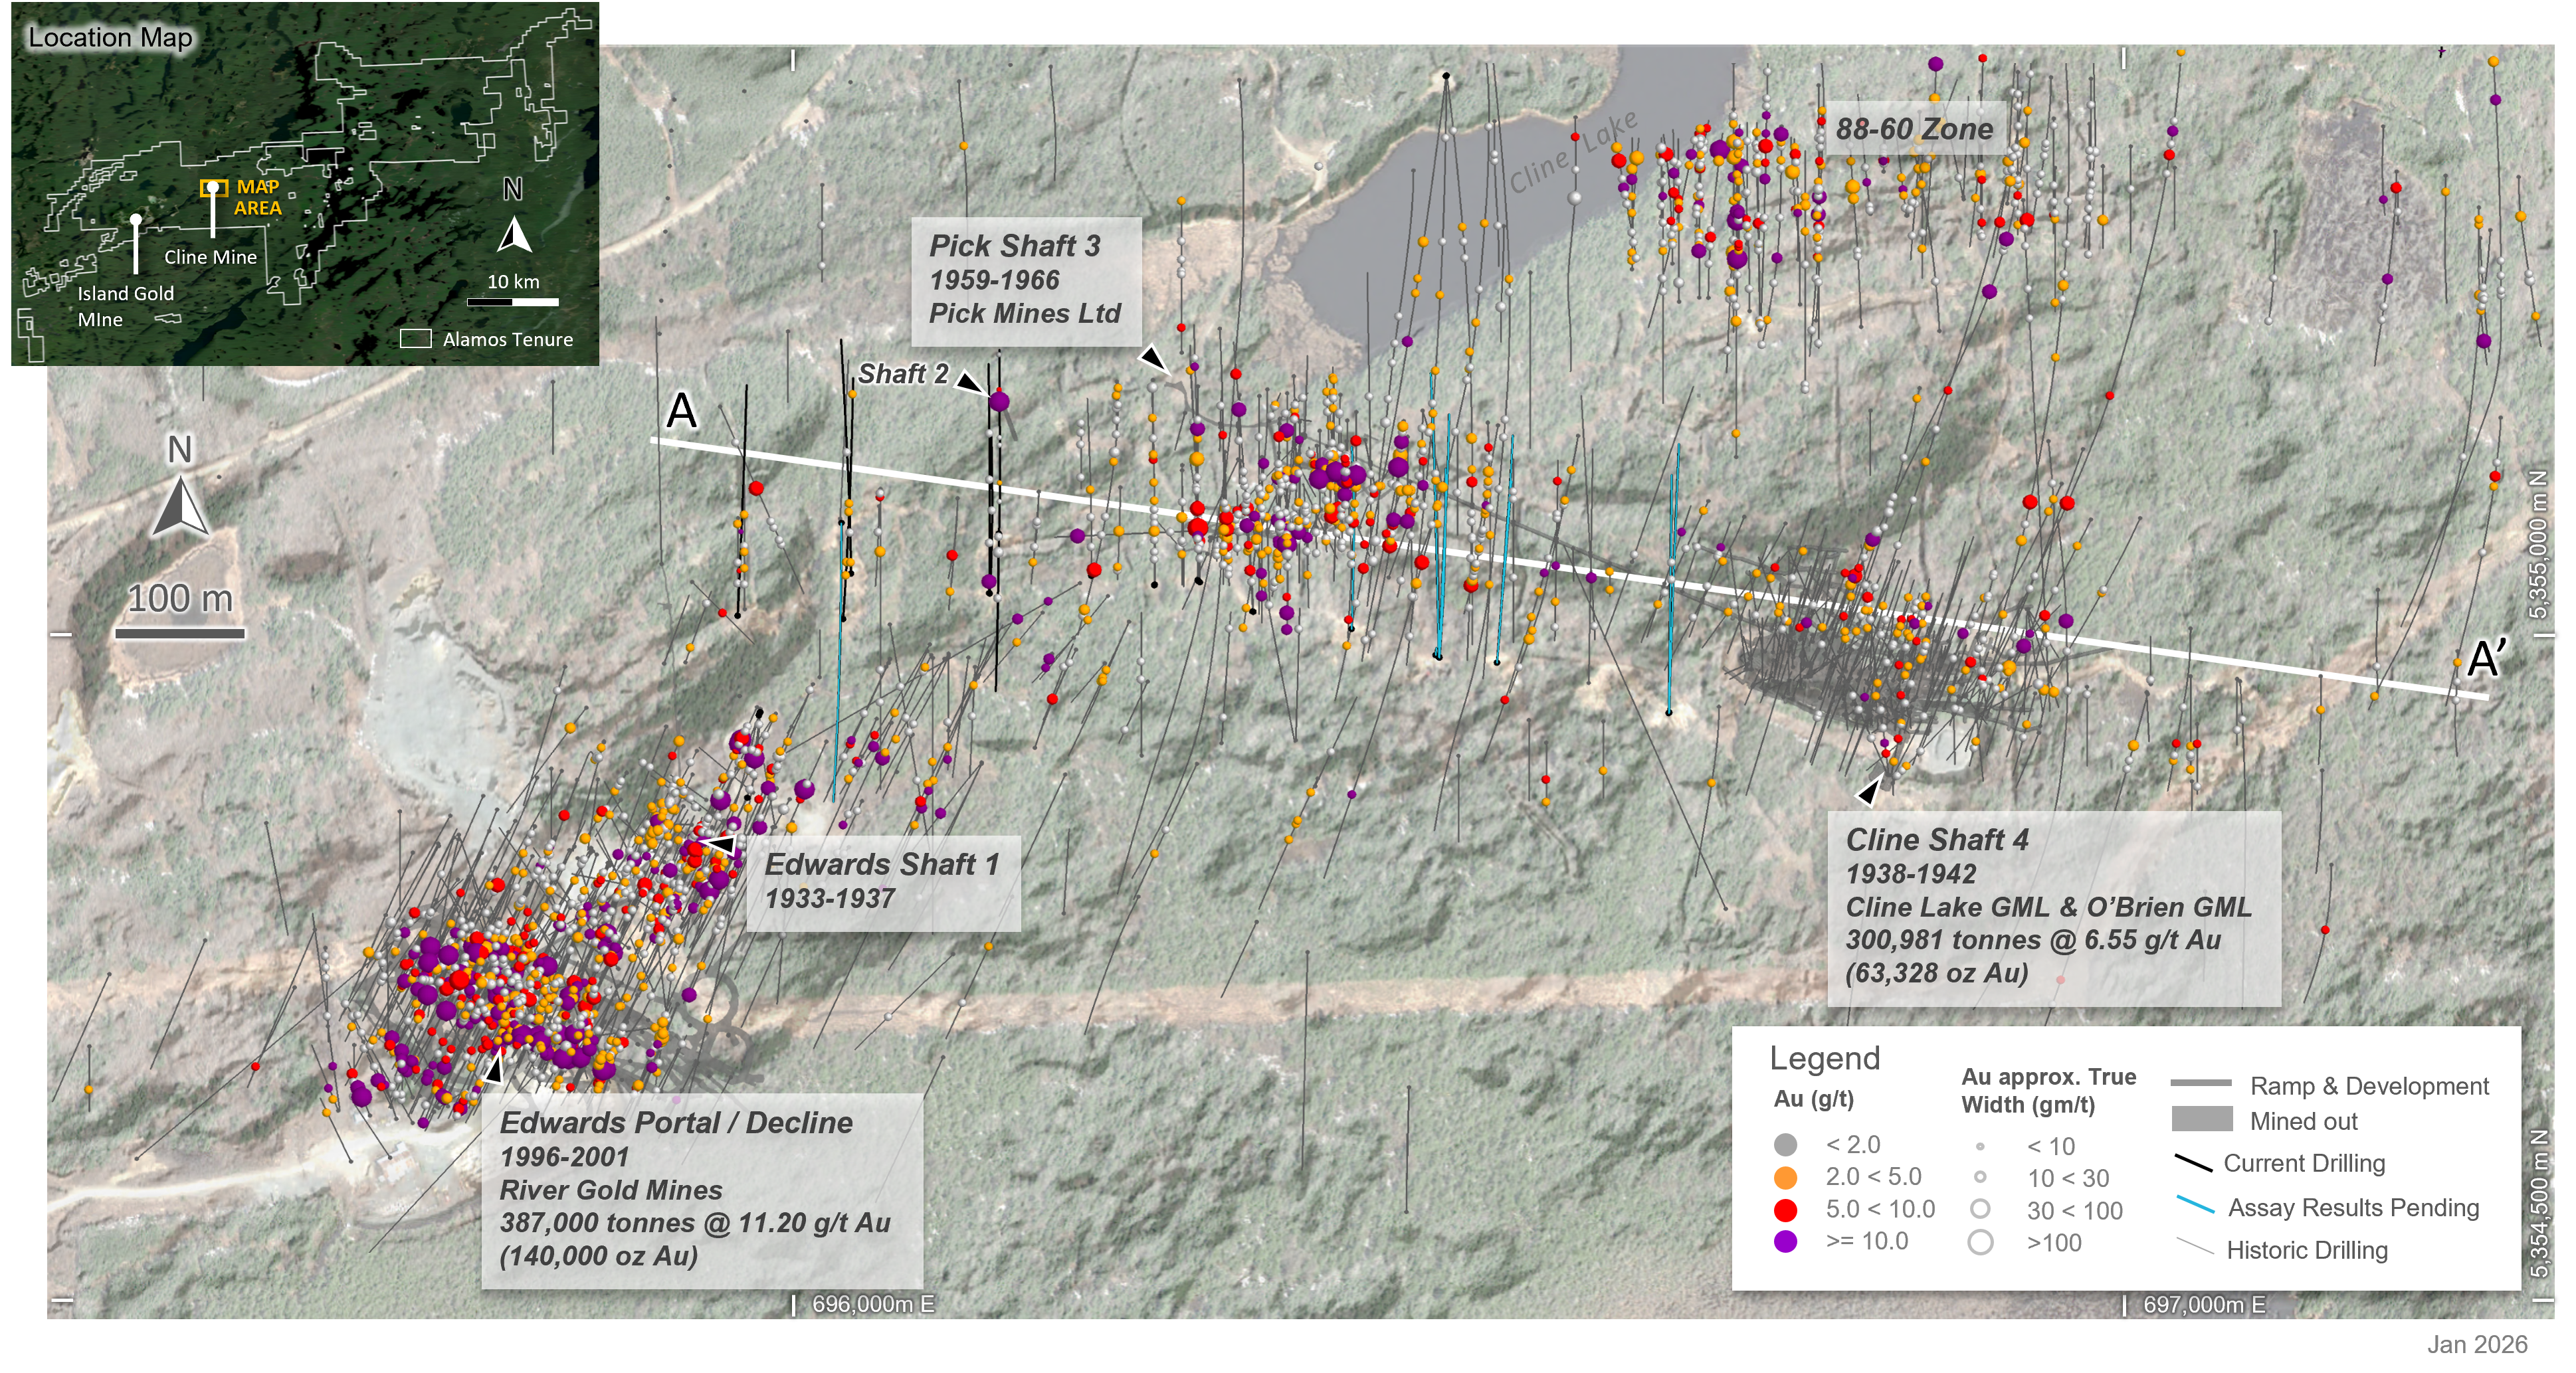
Figure 6: Cline-Pick Mines Longitudinal with Current and Historic Drilling
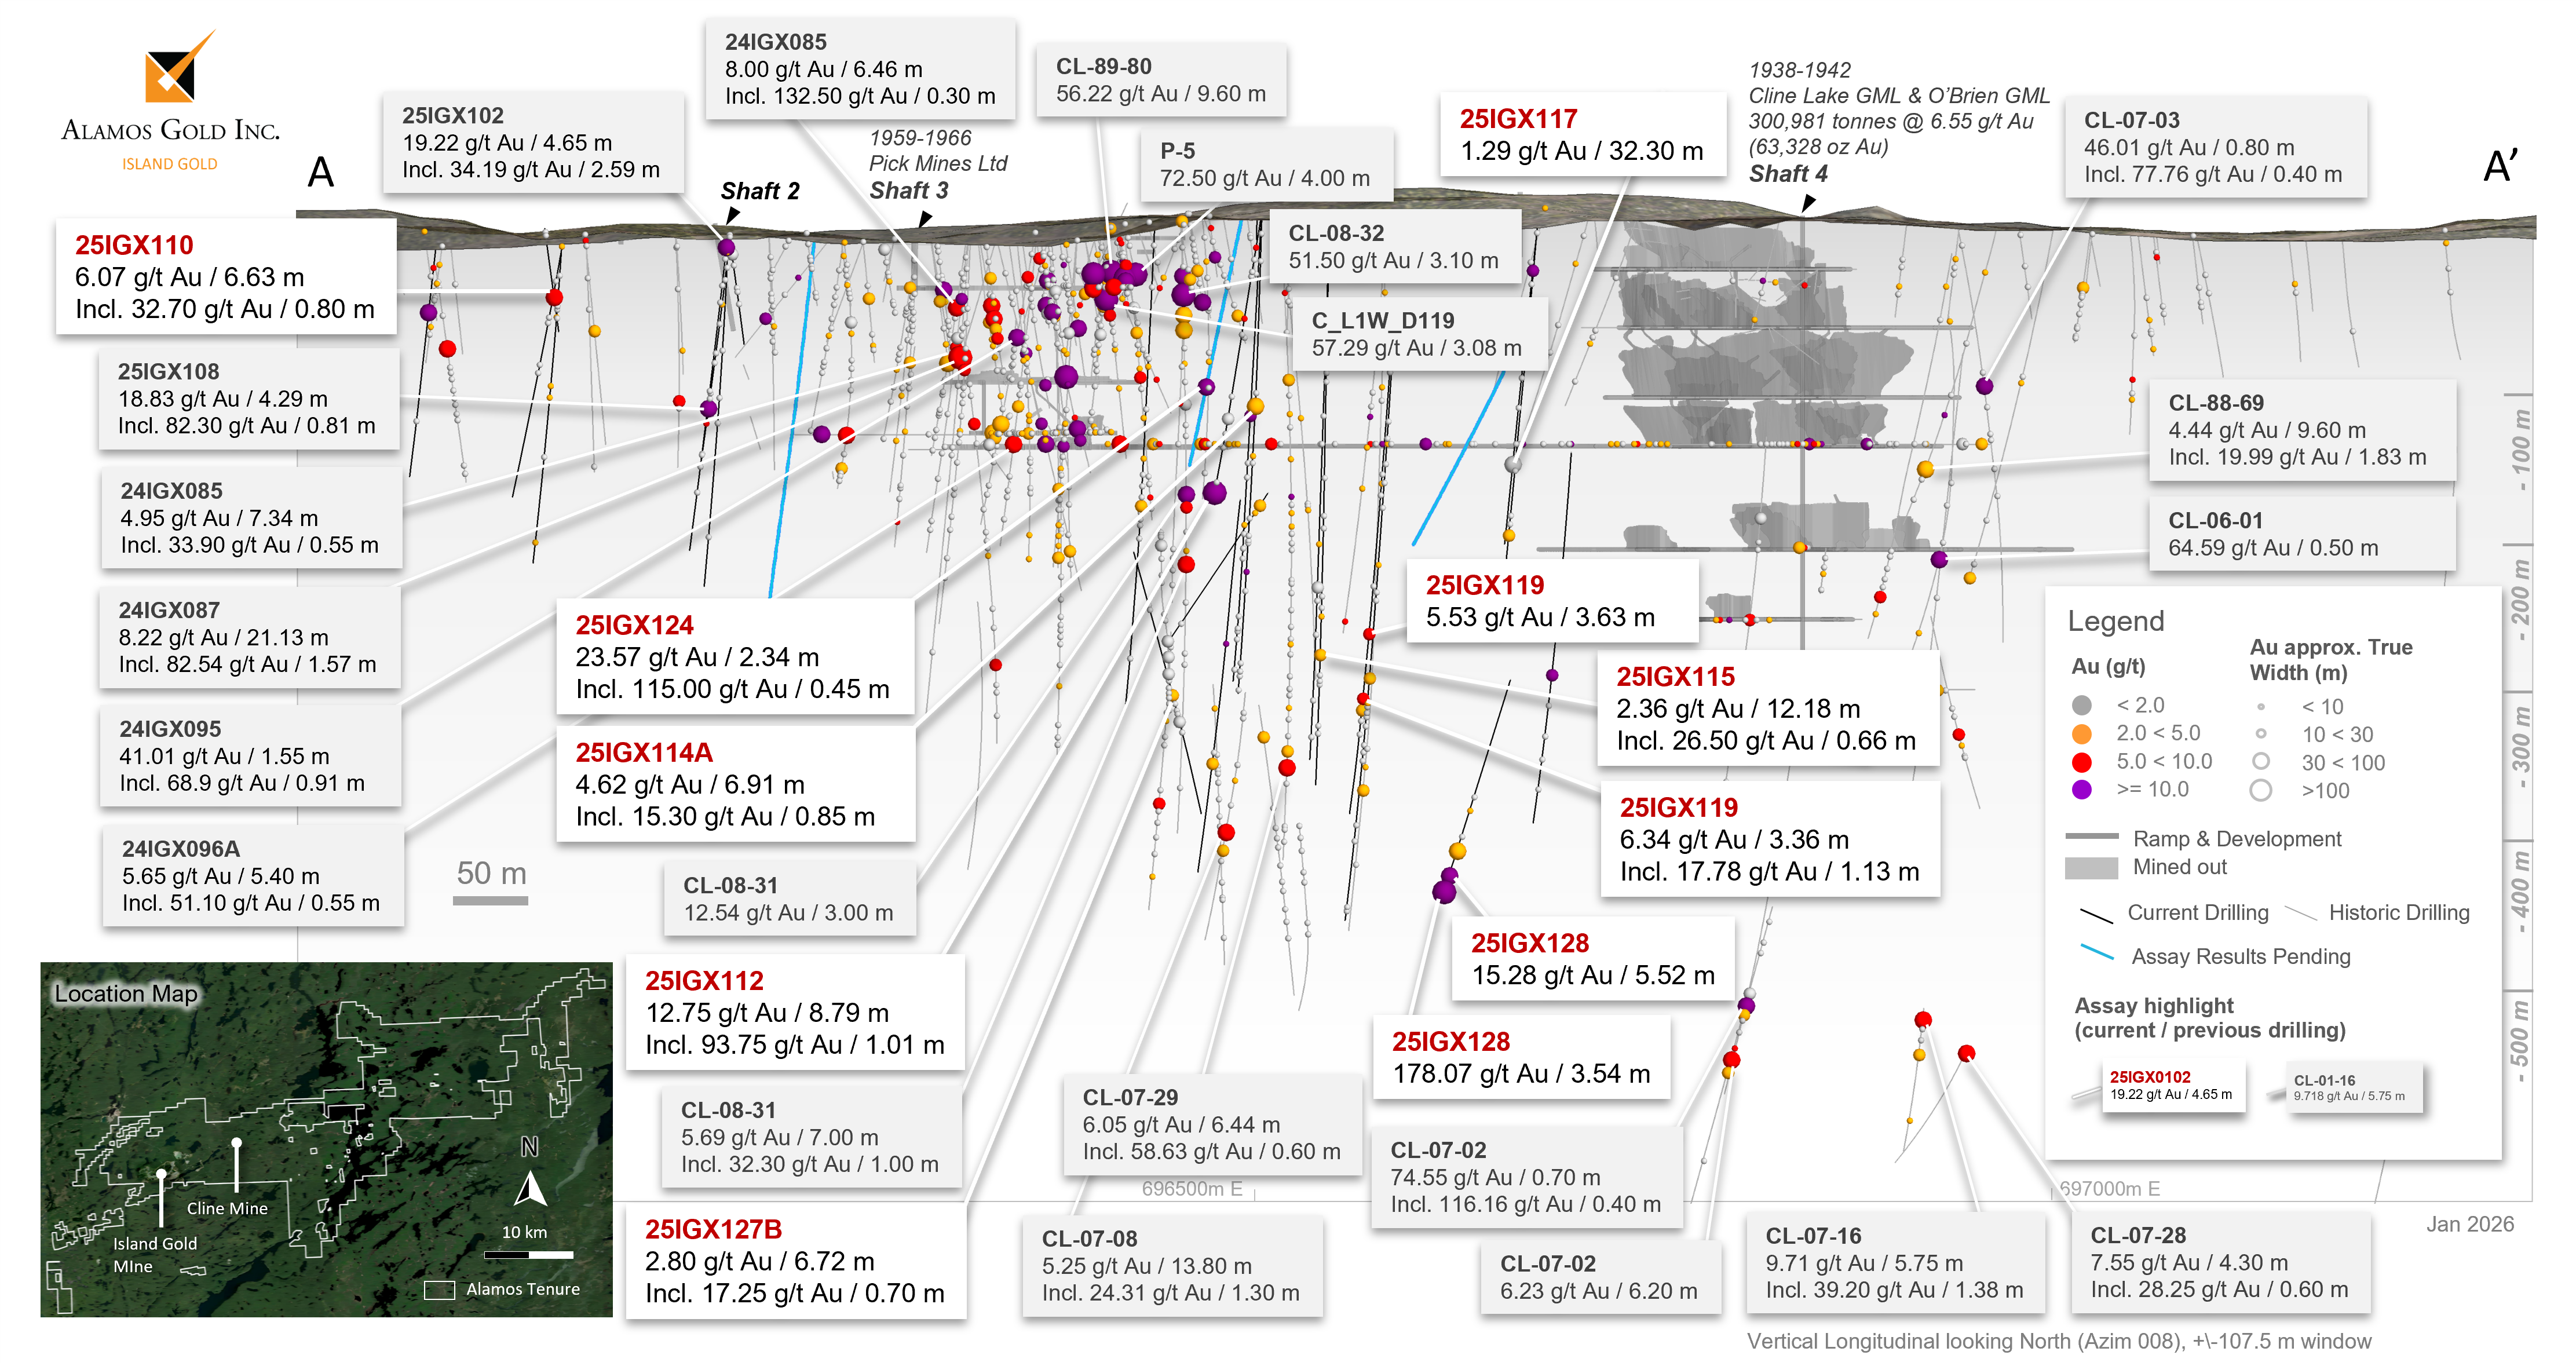
Figure 7: Cline-Pick Core Photo – High-Grade Quartz Vein in Drill hole 25IGX128
Figures accompanying this announcement are available at: